| Full name: SCY1 like pseudokinase 1 | Alias Symbol: HT019|P105|GKLP|NKTL|TAPK|TRAP|TEIF|MGC78454 | ||
| Type: protein-coding gene | Cytoband: 11q13.1 | ||
| Entrez ID: 57410 | HGNC ID: HGNC:14372 | Ensembl Gene: ENSG00000142186 | OMIM ID: 607982 |
Screen Evidence:
| |||
Expression of SCYL1:
| Dataset | Gene | EntrezID | Probe | Log2FC | Adj.pValue | Expression |
|---|---|---|---|---|---|---|
| GSE17351 | SCYL1 | 57410 | 223033_s_at | 0.5450 | 0.1100 | |
| GSE26886 | SCYL1 | 57410 | 223033_s_at | 1.3744 | 0.0000 | |
| GSE45670 | SCYL1 | 57410 | 223033_s_at | 0.2487 | 0.0610 | |
| GSE63941 | SCYL1 | 57410 | 223033_s_at | -0.8023 | 0.1037 | |
| GSE77861 | SCYL1 | 57410 | 223033_s_at | 0.6191 | 0.0007 | |
| GSE97050 | SCYL1 | 57410 | A_24_P30314 | 0.2406 | 0.3051 | |
| SRP007169 | SCYL1 | 57410 | RNAseq | 0.9102 | 0.0574 | |
| SRP008496 | SCYL1 | 57410 | RNAseq | 0.9819 | 0.0006 | |
| SRP064894 | SCYL1 | 57410 | RNAseq | 0.3778 | 0.0350 | |
| SRP133303 | SCYL1 | 57410 | RNAseq | 0.4280 | 0.0556 | |
| SRP159526 | SCYL1 | 57410 | RNAseq | 0.3553 | 0.0279 | |
| SRP193095 | SCYL1 | 57410 | RNAseq | 0.3582 | 0.0001 | |
| SRP219564 | SCYL1 | 57410 | RNAseq | 0.1685 | 0.6104 | |
| TCGA | SCYL1 | 57410 | RNAseq | 0.0200 | 0.6505 |
Upregulated datasets: 1; Downregulated datasets: 0.
Survival by SCYL1 expression:
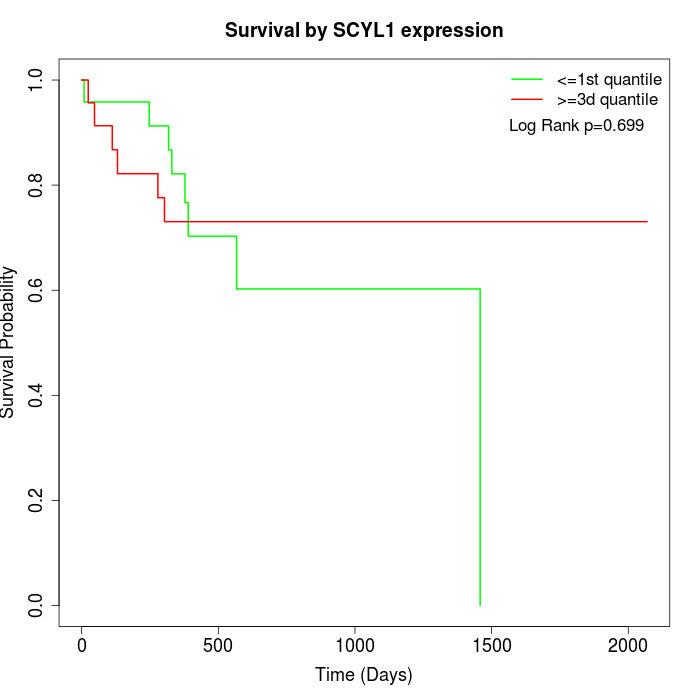 |
| TCGA |
Note: Click image to view full size file.
Copy number change of SCYL1:
| Dataset | Gene | EntrezID | Gain | Loss | Normal | Detail |
|---|---|---|---|---|---|---|
| GSE15526 | SCYL1 | 57410 | 8 | 5 | 17 | |
| GSE20123 | SCYL1 | 57410 | 8 | 5 | 17 | |
| GSE43470 | SCYL1 | 57410 | 4 | 1 | 38 | |
| GSE46452 | SCYL1 | 57410 | 11 | 3 | 45 | |
| GSE47630 | SCYL1 | 57410 | 7 | 5 | 28 | |
| GSE54993 | SCYL1 | 57410 | 3 | 0 | 67 | |
| GSE54994 | SCYL1 | 57410 | 7 | 5 | 41 | |
| GSE60625 | SCYL1 | 57410 | 0 | 3 | 8 | |
| GSE74703 | SCYL1 | 57410 | 3 | 0 | 33 | |
| GSE74704 | SCYL1 | 57410 | 6 | 3 | 11 | |
| TCGA | SCYL1 | 57410 | 23 | 7 | 66 |
Total number of gains: 80; Total number of losses: 37; Total Number of normals: 371.
Somatic mutations of SCYL1:
Generating mutation plots.
Highly correlated genes for SCYL1:
Showing top 20/1165 corelated genes with mean PCC>0.5.
| Gene1 | Gene2 | Mean PCC | Num. Datasets | Num. PCC<0 | Num. PCC>0.5 |
|---|---|---|---|---|---|
| SCYL1 | PXN | 0.785228 | 4 | 0 | 4 |
| SCYL1 | CCDC86 | 0.781021 | 5 | 0 | 5 |
| SCYL1 | HOMER3 | 0.776744 | 4 | 0 | 4 |
| SCYL1 | LOXL1 | 0.766778 | 3 | 0 | 3 |
| SCYL1 | PUS1 | 0.764055 | 4 | 0 | 4 |
| SCYL1 | IGF1R | 0.759189 | 3 | 0 | 3 |
| SCYL1 | PLTP | 0.756963 | 4 | 0 | 4 |
| SCYL1 | ANO1 | 0.754728 | 3 | 0 | 3 |
| SCYL1 | RAB32 | 0.754091 | 4 | 0 | 4 |
| SCYL1 | IMP4 | 0.753364 | 5 | 0 | 5 |
| SCYL1 | COL4A2 | 0.747751 | 4 | 0 | 3 |
| SCYL1 | PTPRZ1 | 0.747187 | 3 | 0 | 3 |
| SCYL1 | PTRH2 | 0.741329 | 5 | 0 | 5 |
| SCYL1 | PAM16 | 0.740452 | 3 | 0 | 3 |
| SCYL1 | RILPL2 | 0.740013 | 3 | 0 | 3 |
| SCYL1 | MLF1 | 0.73525 | 4 | 0 | 3 |
| SCYL1 | SF3B2 | 0.735042 | 6 | 0 | 5 |
| SCYL1 | MISP | 0.731484 | 3 | 0 | 3 |
| SCYL1 | USB1 | 0.731259 | 4 | 0 | 3 |
| SCYL1 | C1R | 0.730948 | 3 | 0 | 3 |
For details and further investigation, click here