| Full name: adaptor related protein complex 2 subunit sigma 1 | Alias Symbol: FBHOk|FBH3 | ||
| Type: protein-coding gene | Cytoband: 19q13.32 | ||
| Entrez ID: 1175 | HGNC ID: HGNC:565 | Ensembl Gene: ENSG00000042753 | OMIM ID: 602242 |
Screen Evidence:
| |||
AP2S1 involved pathways:
| KEGG pathway | Description | View |
|---|---|---|
| hsa05016 | Huntington's disease |
Expression of AP2S1:
| Dataset | Gene | EntrezID | Probe | Log2FC | Adj.pValue | Expression |
|---|---|---|---|---|---|---|
| GSE17351 | AP2S1 | 1175 | 208074_s_at | 0.1392 | 0.7860 | |
| GSE20347 | AP2S1 | 1175 | 211047_x_at | -0.3008 | 0.0342 | |
| GSE23400 | AP2S1 | 1175 | 211047_x_at | 0.1342 | 0.1051 | |
| GSE26886 | AP2S1 | 1175 | 211047_x_at | -0.0310 | 0.8867 | |
| GSE29001 | AP2S1 | 1175 | 211047_x_at | -0.2142 | 0.6164 | |
| GSE38129 | AP2S1 | 1175 | 211047_x_at | 0.1529 | 0.3148 | |
| GSE45670 | AP2S1 | 1175 | 208074_s_at | 0.0430 | 0.8444 | |
| GSE53622 | AP2S1 | 1175 | 15501 | -0.2812 | 0.0004 | |
| GSE53624 | AP2S1 | 1175 | 15501 | 0.2520 | 0.0000 | |
| GSE63941 | AP2S1 | 1175 | 211047_x_at | 0.3031 | 0.3833 | |
| GSE77861 | AP2S1 | 1175 | 211047_x_at | -0.2429 | 0.4000 | |
| GSE97050 | AP2S1 | 1175 | A_33_P3346663 | 0.3055 | 0.4611 | |
| SRP007169 | AP2S1 | 1175 | RNAseq | -1.4194 | 0.0000 | |
| SRP008496 | AP2S1 | 1175 | RNAseq | -1.4942 | 0.0000 | |
| SRP064894 | AP2S1 | 1175 | RNAseq | 0.4835 | 0.1710 | |
| SRP133303 | AP2S1 | 1175 | RNAseq | -0.0699 | 0.7046 | |
| SRP159526 | AP2S1 | 1175 | RNAseq | 0.0611 | 0.7983 | |
| SRP193095 | AP2S1 | 1175 | RNAseq | -0.3615 | 0.0259 | |
| SRP219564 | AP2S1 | 1175 | RNAseq | 0.1782 | 0.6619 | |
| TCGA | AP2S1 | 1175 | RNAseq | 0.2615 | 0.0000 |
Upregulated datasets: 0; Downregulated datasets: 2.
Survival by AP2S1 expression:
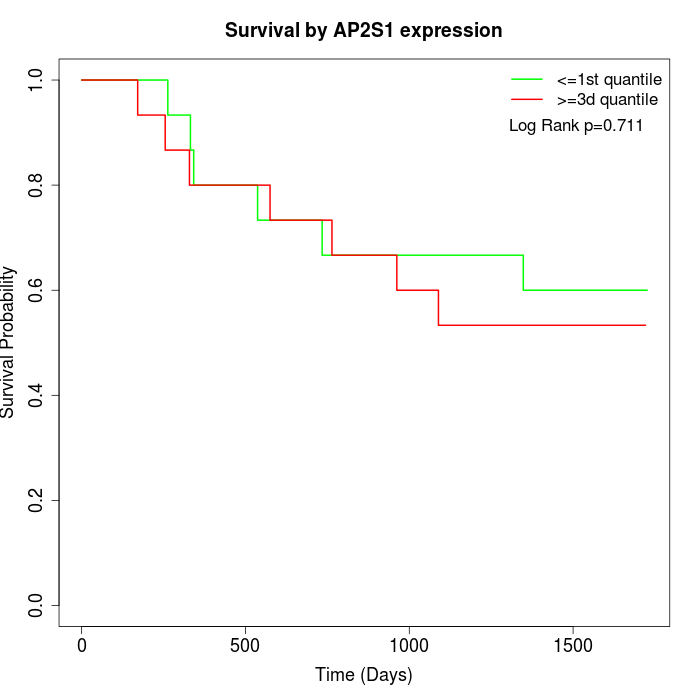 | 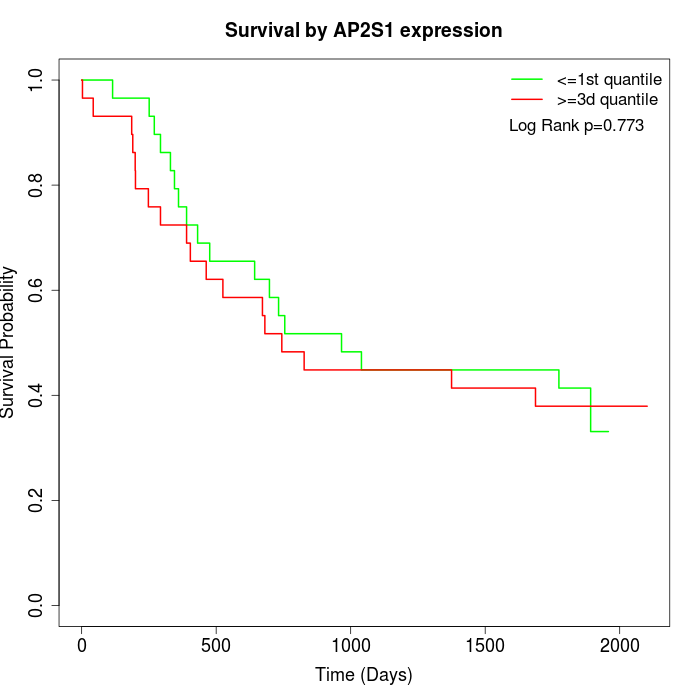 | 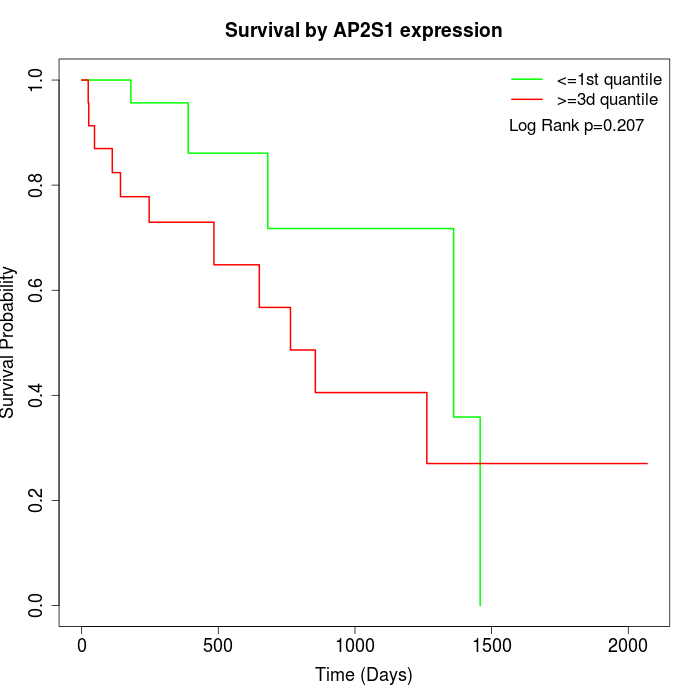 |
| GSE53622 | GSE53624 | TCGA |
Note: Click image to view full size file.
Copy number change of AP2S1:
| Dataset | Gene | EntrezID | Gain | Loss | Normal | Detail |
|---|---|---|---|---|---|---|
| GSE15526 | AP2S1 | 1175 | 4 | 4 | 22 | |
| GSE20123 | AP2S1 | 1175 | 4 | 3 | 23 | |
| GSE43470 | AP2S1 | 1175 | 3 | 11 | 29 | |
| GSE46452 | AP2S1 | 1175 | 45 | 1 | 13 | |
| GSE47630 | AP2S1 | 1175 | 8 | 7 | 25 | |
| GSE54993 | AP2S1 | 1175 | 17 | 4 | 49 | |
| GSE54994 | AP2S1 | 1175 | 5 | 13 | 35 | |
| GSE60625 | AP2S1 | 1175 | 9 | 0 | 2 | |
| GSE74703 | AP2S1 | 1175 | 3 | 7 | 26 | |
| GSE74704 | AP2S1 | 1175 | 4 | 1 | 15 | |
| TCGA | AP2S1 | 1175 | 16 | 16 | 64 |
Total number of gains: 118; Total number of losses: 67; Total Number of normals: 303.
Somatic mutations of AP2S1:
Generating mutation plots.
Highly correlated genes for AP2S1:
Showing top 20/384 corelated genes with mean PCC>0.5.
| Gene1 | Gene2 | Mean PCC | Num. Datasets | Num. PCC<0 | Num. PCC>0.5 |
|---|---|---|---|---|---|
| AP2S1 | ZNF101 | 0.779063 | 3 | 0 | 3 |
| AP2S1 | FAM83B | 0.774674 | 3 | 0 | 3 |
| AP2S1 | NHSL1 | 0.765063 | 3 | 0 | 3 |
| AP2S1 | MAP7 | 0.730179 | 3 | 0 | 3 |
| AP2S1 | UNC5B | 0.728661 | 4 | 0 | 4 |
| AP2S1 | ZDHHC5 | 0.720601 | 3 | 0 | 3 |
| AP2S1 | SLC22A23 | 0.71578 | 3 | 0 | 3 |
| AP2S1 | AP1S3 | 0.713753 | 3 | 0 | 3 |
| AP2S1 | DOLPP1 | 0.713054 | 4 | 0 | 3 |
| AP2S1 | LPAR5 | 0.701334 | 3 | 0 | 3 |
| AP2S1 | TMEM238 | 0.695061 | 3 | 0 | 3 |
| AP2S1 | ZDHHC13 | 0.688898 | 3 | 0 | 3 |
| AP2S1 | CDH1 | 0.672746 | 5 | 0 | 3 |
| AP2S1 | RASGRP1 | 0.665961 | 3 | 0 | 3 |
| AP2S1 | SLC39A11 | 0.664948 | 3 | 0 | 3 |
| AP2S1 | SH3BGRL3 | 0.663472 | 10 | 0 | 10 |
| AP2S1 | CHMP4C | 0.658586 | 3 | 0 | 3 |
| AP2S1 | RIPK3 | 0.65723 | 4 | 0 | 4 |
| AP2S1 | CDS1 | 0.656199 | 4 | 0 | 3 |
| AP2S1 | BTBD11 | 0.655236 | 3 | 0 | 3 |
For details and further investigation, click here