| Full name: adaptor related protein complex 1 subunit sigma 3 | Alias Symbol: | ||
| Type: protein-coding gene | Cytoband: 2q36.1 | ||
| Entrez ID: 130340 | HGNC ID: HGNC:18971 | Ensembl Gene: ENSG00000152056 | OMIM ID: 615781 |
Expression of AP1S3:
| Dataset | Gene | EntrezID | Probe | Log2FC | Adj.pValue | Expression |
|---|---|---|---|---|---|---|
| GSE17351 | AP1S3 | 130340 | 237159_x_at | 0.6486 | 0.5230 | |
| GSE26886 | AP1S3 | 130340 | 237159_x_at | 0.7887 | 0.0611 | |
| GSE45670 | AP1S3 | 130340 | 237159_x_at | 0.4251 | 0.0204 | |
| GSE53622 | AP1S3 | 130340 | 59847 | -0.1551 | 0.4121 | |
| GSE53624 | AP1S3 | 130340 | 70417 | -0.3905 | 0.0001 | |
| GSE63941 | AP1S3 | 130340 | 1555731_a_at | 4.7610 | 0.0000 | |
| GSE77861 | AP1S3 | 130340 | 237159_x_at | -0.0820 | 0.7139 | |
| GSE97050 | AP1S3 | 130340 | A_33_P3289005 | 1.3892 | 0.2826 | |
| SRP007169 | AP1S3 | 130340 | RNAseq | 0.0495 | 0.9223 | |
| SRP008496 | AP1S3 | 130340 | RNAseq | -0.0999 | 0.7586 | |
| SRP064894 | AP1S3 | 130340 | RNAseq | -0.5024 | 0.0922 | |
| SRP133303 | AP1S3 | 130340 | RNAseq | 0.2278 | 0.3440 | |
| SRP159526 | AP1S3 | 130340 | RNAseq | -0.2232 | 0.5848 | |
| SRP193095 | AP1S3 | 130340 | RNAseq | -0.3434 | 0.0032 | |
| SRP219564 | AP1S3 | 130340 | RNAseq | 0.1893 | 0.7676 | |
| TCGA | AP1S3 | 130340 | RNAseq | 0.0017 | 0.9889 |
Upregulated datasets: 1; Downregulated datasets: 0.
Survival by AP1S3 expression:
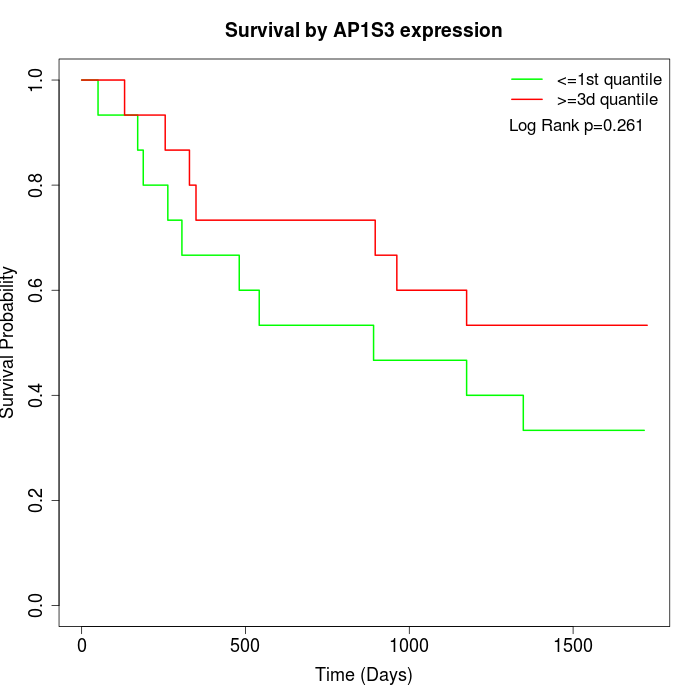 | 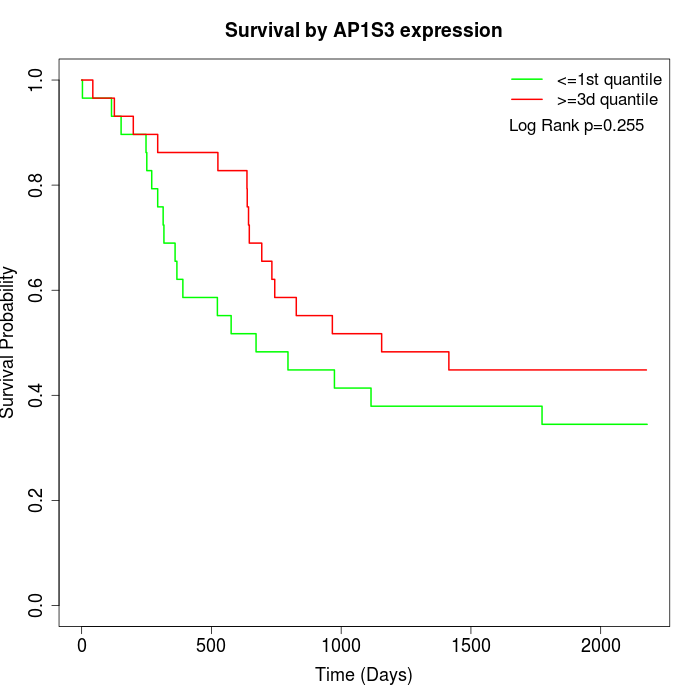 | 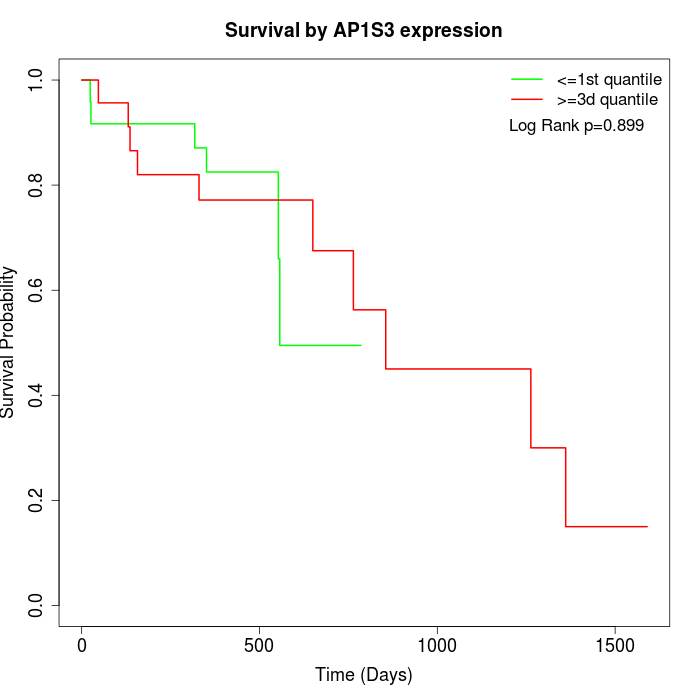 |
| GSE53622 | GSE53624 | TCGA |
Note: Click image to view full size file.
Copy number change of AP1S3:
| Dataset | Gene | EntrezID | Gain | Loss | Normal | Detail |
|---|---|---|---|---|---|---|
| GSE15526 | AP1S3 | 130340 | 2 | 12 | 16 | |
| GSE20123 | AP1S3 | 130340 | 2 | 12 | 16 | |
| GSE43470 | AP1S3 | 130340 | 0 | 7 | 36 | |
| GSE46452 | AP1S3 | 130340 | 0 | 5 | 54 | |
| GSE47630 | AP1S3 | 130340 | 4 | 5 | 31 | |
| GSE54993 | AP1S3 | 130340 | 1 | 2 | 67 | |
| GSE54994 | AP1S3 | 130340 | 7 | 10 | 36 | |
| GSE60625 | AP1S3 | 130340 | 3 | 0 | 8 | |
| GSE74703 | AP1S3 | 130340 | 0 | 6 | 30 | |
| GSE74704 | AP1S3 | 130340 | 2 | 6 | 12 | |
| TCGA | AP1S3 | 130340 | 13 | 27 | 56 |
Total number of gains: 34; Total number of losses: 92; Total Number of normals: 362.
Somatic mutations of AP1S3:
Generating mutation plots.
Highly correlated genes for AP1S3:
Showing top 20/449 corelated genes with mean PCC>0.5.
| Gene1 | Gene2 | Mean PCC | Num. Datasets | Num. PCC<0 | Num. PCC>0.5 |
|---|---|---|---|---|---|
| AP1S3 | GALNT3 | 0.824969 | 4 | 0 | 4 |
| AP1S3 | BUB3 | 0.785745 | 3 | 0 | 3 |
| AP1S3 | DSG2 | 0.782679 | 3 | 0 | 3 |
| AP1S3 | DIAPH1 | 0.781277 | 4 | 0 | 4 |
| AP1S3 | MREG | 0.772626 | 5 | 0 | 5 |
| AP1S3 | BIK | 0.765631 | 3 | 0 | 3 |
| AP1S3 | IRX3 | 0.763187 | 3 | 0 | 3 |
| AP1S3 | PTBP3 | 0.761895 | 4 | 0 | 4 |
| AP1S3 | TMPO | 0.749247 | 3 | 0 | 3 |
| AP1S3 | NDC80 | 0.747978 | 4 | 0 | 4 |
| AP1S3 | MEN1 | 0.74397 | 3 | 0 | 3 |
| AP1S3 | BORA | 0.740841 | 3 | 0 | 3 |
| AP1S3 | FAM83B | 0.733848 | 5 | 0 | 4 |
| AP1S3 | GINS4 | 0.733298 | 3 | 0 | 3 |
| AP1S3 | WWC1 | 0.730452 | 4 | 0 | 4 |
| AP1S3 | COQ2 | 0.7289 | 3 | 0 | 3 |
| AP1S3 | RMI1 | 0.72785 | 3 | 0 | 3 |
| AP1S3 | MAP7 | 0.725156 | 5 | 0 | 4 |
| AP1S3 | KIF14 | 0.723746 | 3 | 0 | 3 |
| AP1S3 | STXBP2 | 0.723041 | 3 | 0 | 3 |
For details and further investigation, click here