| Full name: achaete-scute family bHLH transcription factor 3 | Alias Symbol: bHLHa42|HASH3|Sgn1 | ||
| Type: protein-coding gene | Cytoband: 11p15.4 | ||
| Entrez ID: 56676 | HGNC ID: HGNC:740 | Ensembl Gene: ENSG00000176009 | OMIM ID: 609154 |
Expression of ASCL3:
| Dataset | Gene | EntrezID | Probe | Log2FC | Adj.pValue | Expression |
|---|---|---|---|---|---|---|
| GSE17351 | ASCL3 | 56676 | 221161_at | 0.0300 | 0.9385 | |
| GSE20347 | ASCL3 | 56676 | 221161_at | -0.0510 | 0.6917 | |
| GSE23400 | ASCL3 | 56676 | 221161_at | -0.2084 | 0.0000 | |
| GSE26886 | ASCL3 | 56676 | 221161_at | -0.0610 | 0.6592 | |
| GSE29001 | ASCL3 | 56676 | 221161_at | -0.1863 | 0.2956 | |
| GSE38129 | ASCL3 | 56676 | 221161_at | -0.2058 | 0.0191 | |
| GSE45670 | ASCL3 | 56676 | 221161_at | -0.0523 | 0.6349 | |
| GSE53622 | ASCL3 | 56676 | 73631 | -0.1747 | 0.2000 | |
| GSE53624 | ASCL3 | 56676 | 73631 | -0.0186 | 0.9018 | |
| GSE63941 | ASCL3 | 56676 | 221161_at | 0.0828 | 0.6707 | |
| GSE77861 | ASCL3 | 56676 | 221161_at | -0.1947 | 0.0792 | |
| TCGA | ASCL3 | 56676 | RNAseq | 0.8378 | 0.4726 |
Upregulated datasets: 0; Downregulated datasets: 0.
Survival by ASCL3 expression:
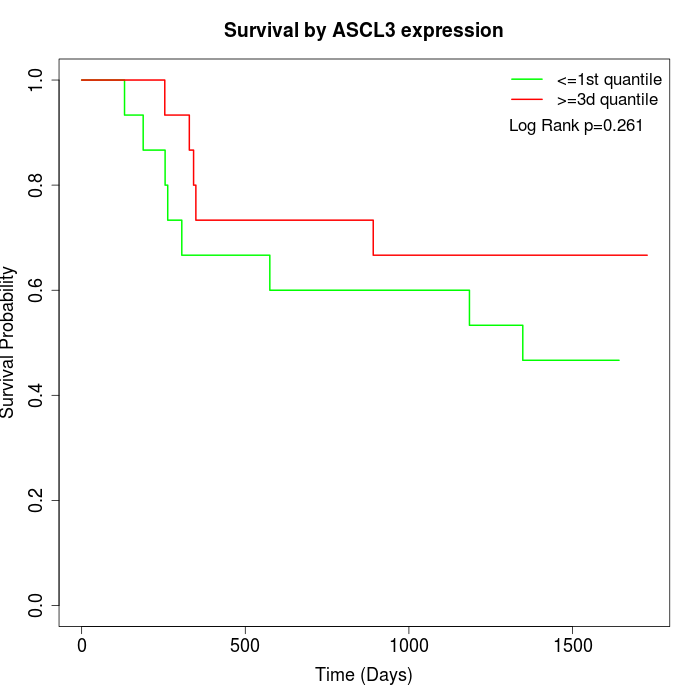 | 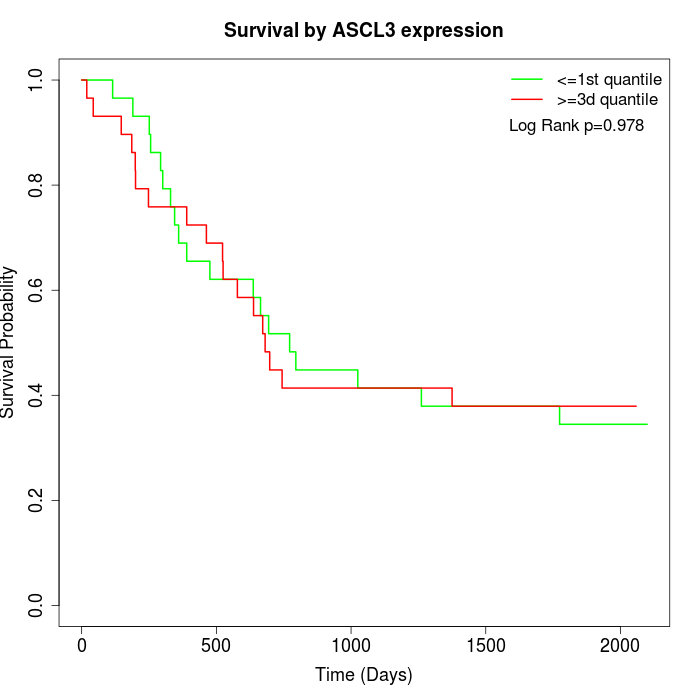 | 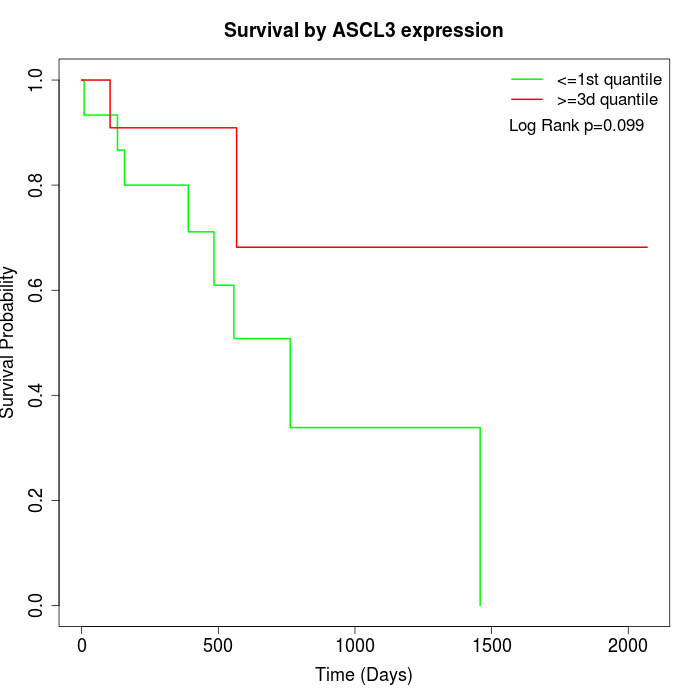 |
| GSE53622 | GSE53624 | TCGA |
Note: Click image to view full size file.
Copy number change of ASCL3:
| Dataset | Gene | EntrezID | Gain | Loss | Normal | Detail |
|---|---|---|---|---|---|---|
| GSE15526 | ASCL3 | 56676 | 0 | 10 | 20 | |
| GSE20123 | ASCL3 | 56676 | 0 | 10 | 20 | |
| GSE43470 | ASCL3 | 56676 | 1 | 5 | 37 | |
| GSE46452 | ASCL3 | 56676 | 7 | 5 | 47 | |
| GSE47630 | ASCL3 | 56676 | 2 | 12 | 26 | |
| GSE54993 | ASCL3 | 56676 | 3 | 1 | 66 | |
| GSE54994 | ASCL3 | 56676 | 2 | 12 | 39 | |
| GSE60625 | ASCL3 | 56676 | 0 | 0 | 11 | |
| GSE74703 | ASCL3 | 56676 | 1 | 3 | 32 | |
| GSE74704 | ASCL3 | 56676 | 0 | 8 | 12 | |
| TCGA | ASCL3 | 56676 | 11 | 34 | 51 |
Total number of gains: 27; Total number of losses: 100; Total Number of normals: 361.
Somatic mutations of ASCL3:
Generating mutation plots.
Highly correlated genes for ASCL3:
Showing top 20/1239 corelated genes with mean PCC>0.5.
| Gene1 | Gene2 | Mean PCC | Num. Datasets | Num. PCC<0 | Num. PCC>0.5 |
|---|---|---|---|---|---|
| ASCL3 | PTPRN2 | 0.751154 | 4 | 0 | 4 |
| ASCL3 | CGA | 0.748554 | 4 | 0 | 4 |
| ASCL3 | PLA2G6 | 0.730438 | 4 | 0 | 4 |
| ASCL3 | RNF17 | 0.729028 | 4 | 0 | 4 |
| ASCL3 | LIMD1-AS1 | 0.721171 | 3 | 0 | 3 |
| ASCL3 | SPX | 0.719338 | 5 | 0 | 5 |
| ASCL3 | CHRM2 | 0.71835 | 4 | 0 | 4 |
| ASCL3 | CA5B | 0.715026 | 3 | 0 | 3 |
| ASCL3 | FRAS1 | 0.711038 | 4 | 0 | 4 |
| ASCL3 | MYH8 | 0.703886 | 3 | 0 | 3 |
| ASCL3 | LINC01119 | 0.703537 | 3 | 0 | 3 |
| ASCL3 | FGF23 | 0.702953 | 7 | 0 | 7 |
| ASCL3 | SLC2A5 | 0.698013 | 3 | 0 | 3 |
| ASCL3 | E2F4 | 0.693375 | 8 | 0 | 7 |
| ASCL3 | MAPK4 | 0.689826 | 3 | 0 | 3 |
| ASCL3 | RIT2 | 0.688668 | 4 | 0 | 3 |
| ASCL3 | CRISP1 | 0.688121 | 5 | 0 | 4 |
| ASCL3 | CDH9 | 0.687852 | 5 | 0 | 5 |
| ASCL3 | ZNF717 | 0.687311 | 5 | 0 | 5 |
| ASCL3 | GABRR2 | 0.685515 | 4 | 0 | 4 |
For details and further investigation, click here