| Full name: asparagine synthetase domain containing 1 | Alias Symbol: NS3TP1|FLJ20752|NBLA00058 | ||
| Type: protein-coding gene | Cytoband: 2q32.2 | ||
| Entrez ID: 54529 | HGNC ID: HGNC:24910 | Ensembl Gene: ENSG00000138381 | OMIM ID: |
Expression of ASNSD1:
| Dataset | Gene | EntrezID | Probe | Log2FC | Adj.pValue | Expression |
|---|---|---|---|---|---|---|
| GSE17351 | ASNSD1 | 54529 | 217987_at | 0.3144 | 0.3968 | |
| GSE20347 | ASNSD1 | 54529 | 217987_at | 0.4724 | 0.0455 | |
| GSE23400 | ASNSD1 | 54529 | 217987_at | 0.4410 | 0.0000 | |
| GSE26886 | ASNSD1 | 54529 | 217987_at | -0.5920 | 0.0739 | |
| GSE29001 | ASNSD1 | 54529 | 217987_at | 0.4330 | 0.0551 | |
| GSE38129 | ASNSD1 | 54529 | 217987_at | 0.4798 | 0.0039 | |
| GSE45670 | ASNSD1 | 54529 | 217987_at | 0.1264 | 0.4587 | |
| GSE53622 | ASNSD1 | 54529 | 57197 | 0.2007 | 0.0120 | |
| GSE53624 | ASNSD1 | 54529 | 57197 | 0.4475 | 0.0000 | |
| GSE63941 | ASNSD1 | 54529 | 217987_at | -1.1533 | 0.0160 | |
| GSE77861 | ASNSD1 | 54529 | 217987_at | 0.8395 | 0.0072 | |
| GSE97050 | ASNSD1 | 54529 | A_23_P91001 | 0.0678 | 0.8400 | |
| SRP007169 | ASNSD1 | 54529 | RNAseq | 0.8096 | 0.0250 | |
| SRP008496 | ASNSD1 | 54529 | RNAseq | 0.8169 | 0.0018 | |
| SRP064894 | ASNSD1 | 54529 | RNAseq | 0.0550 | 0.6853 | |
| SRP133303 | ASNSD1 | 54529 | RNAseq | 0.2839 | 0.0177 | |
| SRP159526 | ASNSD1 | 54529 | RNAseq | -0.0206 | 0.9042 | |
| SRP193095 | ASNSD1 | 54529 | RNAseq | 0.0602 | 0.6914 | |
| SRP219564 | ASNSD1 | 54529 | RNAseq | -0.4358 | 0.1473 | |
| TCGA | ASNSD1 | 54529 | RNAseq | -0.0503 | 0.3133 |
Upregulated datasets: 0; Downregulated datasets: 1.
Survival by ASNSD1 expression:
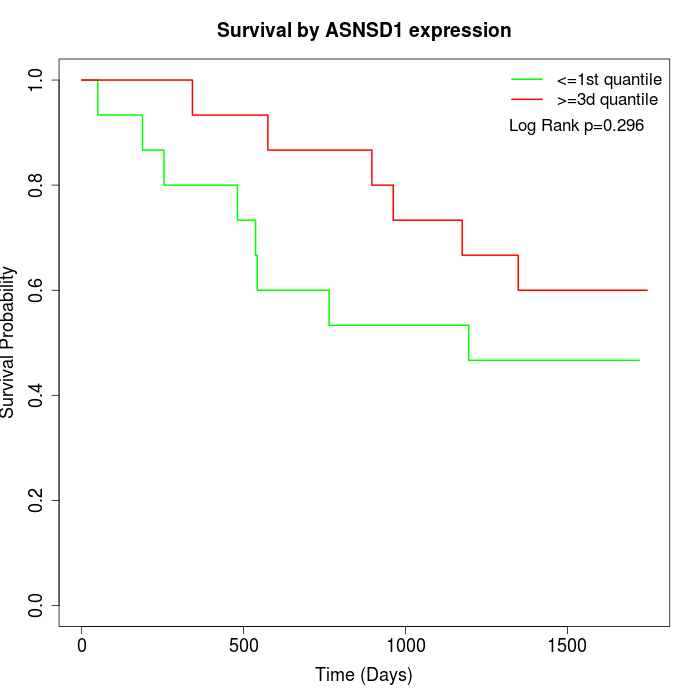 | 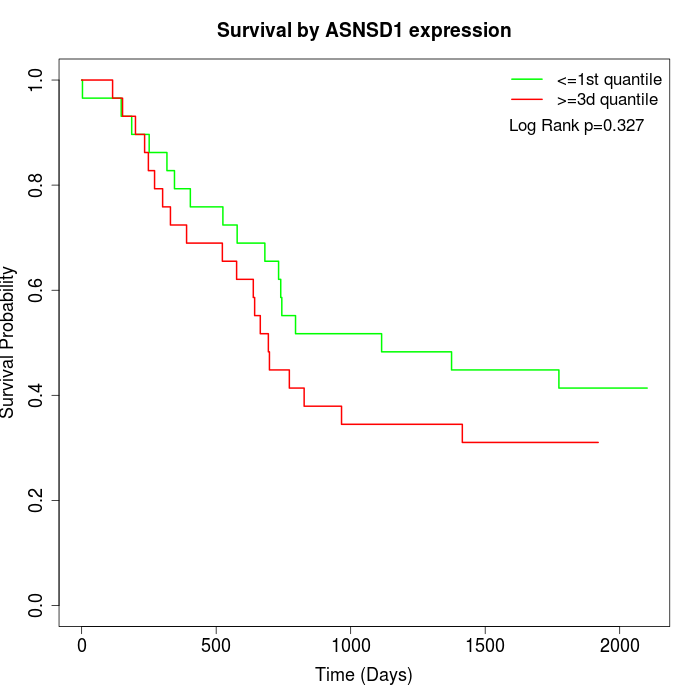 | 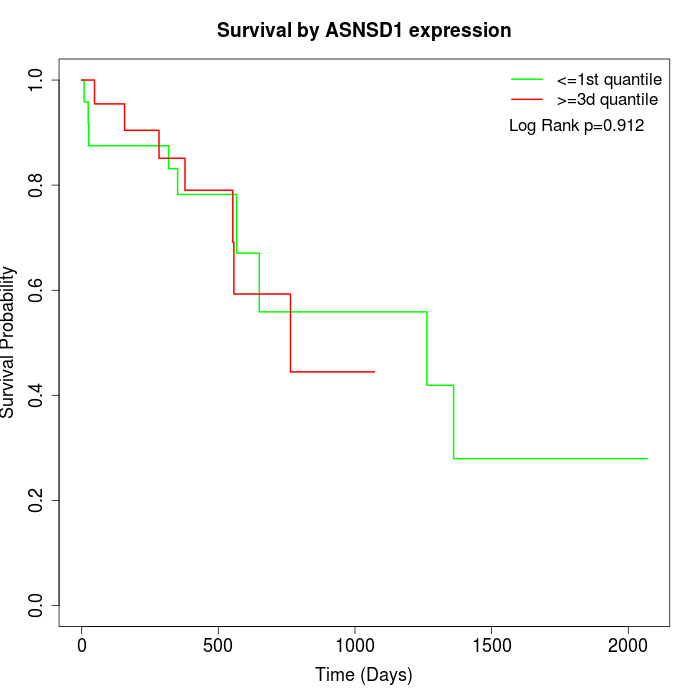 |
| GSE53622 | GSE53624 | TCGA |
Note: Click image to view full size file.
Copy number change of ASNSD1:
| Dataset | Gene | EntrezID | Gain | Loss | Normal | Detail |
|---|---|---|---|---|---|---|
| GSE15526 | ASNSD1 | 54529 | 9 | 3 | 18 | |
| GSE20123 | ASNSD1 | 54529 | 9 | 3 | 18 | |
| GSE43470 | ASNSD1 | 54529 | 3 | 1 | 39 | |
| GSE46452 | ASNSD1 | 54529 | 1 | 4 | 54 | |
| GSE47630 | ASNSD1 | 54529 | 4 | 5 | 31 | |
| GSE54993 | ASNSD1 | 54529 | 0 | 5 | 65 | |
| GSE54994 | ASNSD1 | 54529 | 12 | 6 | 35 | |
| GSE60625 | ASNSD1 | 54529 | 0 | 3 | 8 | |
| GSE74703 | ASNSD1 | 54529 | 2 | 1 | 33 | |
| GSE74704 | ASNSD1 | 54529 | 3 | 3 | 14 | |
| TCGA | ASNSD1 | 54529 | 24 | 6 | 66 |
Total number of gains: 67; Total number of losses: 40; Total Number of normals: 381.
Somatic mutations of ASNSD1:
Generating mutation plots.
Highly correlated genes for ASNSD1:
Showing top 20/748 corelated genes with mean PCC>0.5.
| Gene1 | Gene2 | Mean PCC | Num. Datasets | Num. PCC<0 | Num. PCC>0.5 |
|---|---|---|---|---|---|
| ASNSD1 | WDR5 | 0.799726 | 3 | 0 | 3 |
| ASNSD1 | FAM120B | 0.784871 | 3 | 0 | 3 |
| ASNSD1 | C12orf45 | 0.764533 | 3 | 0 | 3 |
| ASNSD1 | METTL5 | 0.744372 | 10 | 0 | 9 |
| ASNSD1 | STAMBPL1 | 0.743655 | 3 | 0 | 3 |
| ASNSD1 | NUP35 | 0.73868 | 7 | 0 | 7 |
| ASNSD1 | ASAP1-IT2 | 0.737931 | 3 | 0 | 3 |
| ASNSD1 | RAB11FIP5 | 0.735601 | 3 | 0 | 3 |
| ASNSD1 | RTKN | 0.727443 | 3 | 0 | 3 |
| ASNSD1 | ZDHHC17 | 0.724068 | 4 | 0 | 4 |
| ASNSD1 | DHRSX | 0.721894 | 4 | 0 | 4 |
| ASNSD1 | PLEKHG1 | 0.720699 | 3 | 0 | 3 |
| ASNSD1 | SLC10A3 | 0.716323 | 4 | 0 | 3 |
| ASNSD1 | C18orf54 | 0.716152 | 3 | 0 | 3 |
| ASNSD1 | RPF2 | 0.714635 | 4 | 0 | 3 |
| ASNSD1 | EP400 | 0.712954 | 3 | 0 | 3 |
| ASNSD1 | TRUB1 | 0.712547 | 3 | 0 | 3 |
| ASNSD1 | PRKX | 0.708318 | 3 | 0 | 3 |
| ASNSD1 | MAGOHB | 0.707678 | 6 | 0 | 5 |
| ASNSD1 | LIMK1 | 0.705153 | 3 | 0 | 3 |
For details and further investigation, click here