| Full name: ATPase phospholipid transporting 9B (putative) | Alias Symbol: ATPIIB | ||
| Type: protein-coding gene | Cytoband: 18q23 | ||
| Entrez ID: 374868 | HGNC ID: HGNC:13541 | Ensembl Gene: ENSG00000166377 | OMIM ID: 614446 |
Expression of ATP9B:
| Dataset | Gene | EntrezID | Probe | Log2FC | Adj.pValue | Expression |
|---|---|---|---|---|---|---|
| GSE17351 | ATP9B | 374868 | 214934_at | -0.0159 | 0.9697 | |
| GSE20347 | ATP9B | 374868 | 214934_at | -0.7430 | 0.0000 | |
| GSE23400 | ATP9B | 374868 | 214010_s_at | -0.1488 | 0.0000 | |
| GSE26886 | ATP9B | 374868 | 214934_at | -0.0753 | 0.7241 | |
| GSE29001 | ATP9B | 374868 | 214934_at | -0.7047 | 0.0010 | |
| GSE38129 | ATP9B | 374868 | 214934_at | -0.5399 | 0.0003 | |
| GSE45670 | ATP9B | 374868 | 214934_at | -0.1716 | 0.2214 | |
| GSE53622 | ATP9B | 374868 | 144431 | -0.6755 | 0.0000 | |
| GSE53624 | ATP9B | 374868 | 80758 | -0.6256 | 0.0000 | |
| GSE63941 | ATP9B | 374868 | 214934_at | -1.7521 | 0.0098 | |
| GSE77861 | ATP9B | 374868 | 237766_at | -0.1636 | 0.2276 | |
| GSE97050 | ATP9B | 374868 | A_33_P3288039 | -0.6945 | 0.1159 | |
| SRP007169 | ATP9B | 374868 | RNAseq | -1.1880 | 0.0014 | |
| SRP008496 | ATP9B | 374868 | RNAseq | -0.9460 | 0.0002 | |
| SRP064894 | ATP9B | 374868 | RNAseq | -0.3367 | 0.0389 | |
| SRP133303 | ATP9B | 374868 | RNAseq | -0.2707 | 0.2017 | |
| SRP159526 | ATP9B | 374868 | RNAseq | -0.5059 | 0.0444 | |
| SRP193095 | ATP9B | 374868 | RNAseq | -0.4927 | 0.0002 | |
| SRP219564 | ATP9B | 374868 | RNAseq | -0.6204 | 0.1602 | |
| TCGA | ATP9B | 374868 | RNAseq | -0.2920 | 0.0000 |
Upregulated datasets: 0; Downregulated datasets: 2.
Survival by ATP9B expression:
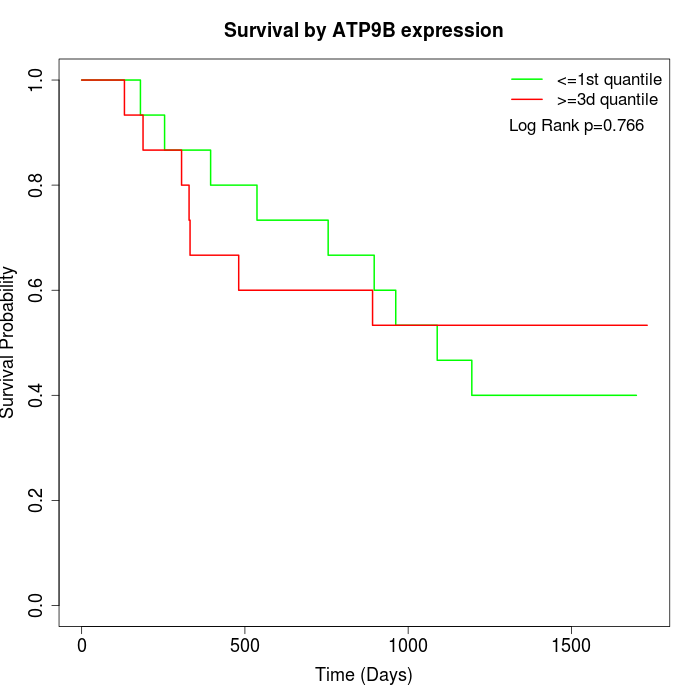 | 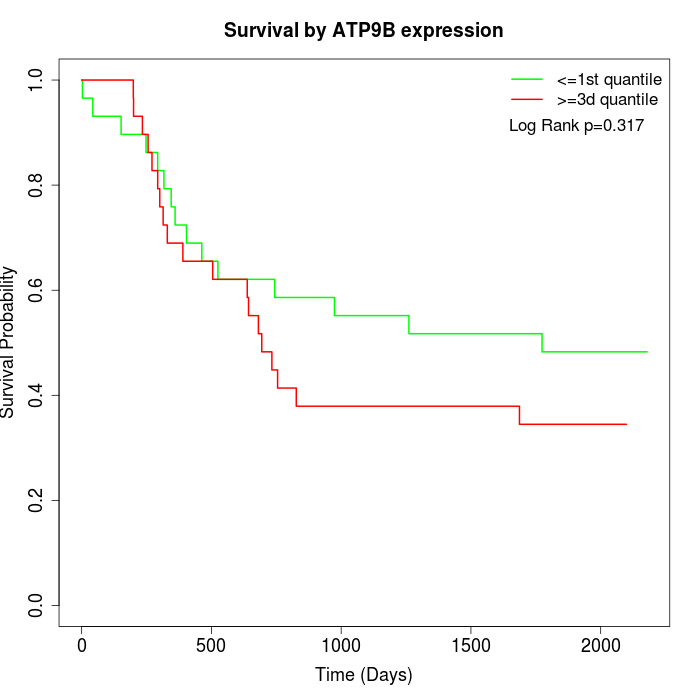 | 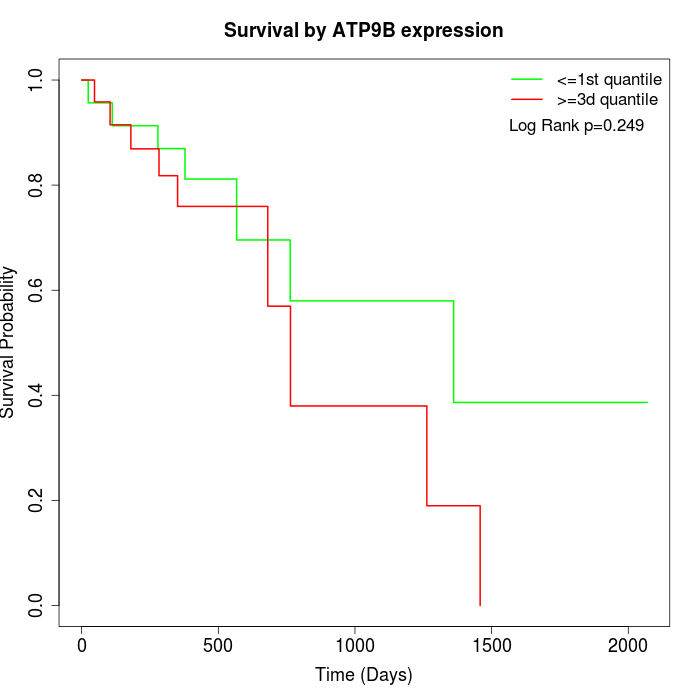 |
| GSE53622 | GSE53624 | TCGA |
Note: Click image to view full size file.
Copy number change of ATP9B:
| Dataset | Gene | EntrezID | Gain | Loss | Normal | Detail |
|---|---|---|---|---|---|---|
| GSE15526 | ATP9B | 374868 | 1 | 12 | 17 | |
| GSE20123 | ATP9B | 374868 | 1 | 12 | 17 | |
| GSE43470 | ATP9B | 374868 | 0 | 12 | 31 | |
| GSE46452 | ATP9B | 374868 | 1 | 26 | 32 | |
| GSE47630 | ATP9B | 374868 | 5 | 22 | 13 | |
| GSE54993 | ATP9B | 374868 | 9 | 0 | 61 | |
| GSE54994 | ATP9B | 374868 | 1 | 19 | 33 | |
| GSE60625 | ATP9B | 374868 | 0 | 4 | 7 | |
| GSE74703 | ATP9B | 374868 | 0 | 8 | 28 | |
| GSE74704 | ATP9B | 374868 | 0 | 9 | 11 | |
| TCGA | ATP9B | 374868 | 8 | 46 | 42 |
Total number of gains: 26; Total number of losses: 170; Total Number of normals: 292.
Somatic mutations of ATP9B:
Generating mutation plots.
Highly correlated genes for ATP9B:
Showing top 20/782 corelated genes with mean PCC>0.5.
| Gene1 | Gene2 | Mean PCC | Num. Datasets | Num. PCC<0 | Num. PCC>0.5 |
|---|---|---|---|---|---|
| ATP9B | ST6GALNAC6 | 0.749061 | 4 | 0 | 4 |
| ATP9B | ABHD14B | 0.730526 | 3 | 0 | 3 |
| ATP9B | PDCD4 | 0.725633 | 4 | 0 | 3 |
| ATP9B | PREPL | 0.708845 | 3 | 0 | 3 |
| ATP9B | SPIN3 | 0.691144 | 3 | 0 | 3 |
| ATP9B | OTUD7B | 0.681309 | 3 | 0 | 3 |
| ATP9B | DNAJC21 | 0.678679 | 3 | 0 | 3 |
| ATP9B | NDUFA13 | 0.673696 | 4 | 0 | 3 |
| ATP9B | CALCOCO2 | 0.671018 | 8 | 0 | 8 |
| ATP9B | RUFY1 | 0.666808 | 7 | 0 | 6 |
| ATP9B | TOMM40L | 0.666408 | 3 | 0 | 3 |
| ATP9B | LZIC | 0.665949 | 3 | 0 | 3 |
| ATP9B | TADA2B | 0.662627 | 5 | 0 | 5 |
| ATP9B | TDRD3 | 0.657409 | 8 | 0 | 8 |
| ATP9B | FBXO33 | 0.656544 | 3 | 0 | 3 |
| ATP9B | EPG5 | 0.651129 | 5 | 0 | 4 |
| ATP9B | CSDE1 | 0.64787 | 5 | 0 | 5 |
| ATP9B | RNF103 | 0.644986 | 6 | 0 | 5 |
| ATP9B | NKIRAS1 | 0.643748 | 5 | 0 | 5 |
| ATP9B | GPRASP2 | 0.639508 | 3 | 0 | 3 |
For details and further investigation, click here