| Full name: Bardet-Biedl syndrome 1 | Alias Symbol: FLJ23590 | ||
| Type: protein-coding gene | Cytoband: 11q13.2 | ||
| Entrez ID: 582 | HGNC ID: HGNC:966 | Ensembl Gene: ENSG00000174483 | OMIM ID: 209901 |
Expression of BBS1:
| Dataset | Gene | EntrezID | Probe | Log2FC | Adj.pValue | Expression |
|---|---|---|---|---|---|---|
| GSE17351 | BBS1 | 582 | 218471_s_at | -0.5868 | 0.2496 | |
| GSE20347 | BBS1 | 582 | 218471_s_at | 0.2956 | 0.1750 | |
| GSE23400 | BBS1 | 582 | 218471_s_at | 0.1397 | 0.0733 | |
| GSE26886 | BBS1 | 582 | 218471_s_at | 0.8761 | 0.0004 | |
| GSE29001 | BBS1 | 582 | 218471_s_at | 0.2296 | 0.4135 | |
| GSE38129 | BBS1 | 582 | 218471_s_at | -0.1225 | 0.6296 | |
| GSE45670 | BBS1 | 582 | 218471_s_at | -0.5030 | 0.0053 | |
| GSE53622 | BBS1 | 582 | 40620 | 0.0822 | 0.4551 | |
| GSE53624 | BBS1 | 582 | 40620 | 0.3240 | 0.0000 | |
| GSE63941 | BBS1 | 582 | 218471_s_at | -0.6650 | 0.2230 | |
| GSE77861 | BBS1 | 582 | 218471_s_at | 0.3178 | 0.2557 | |
| GSE97050 | BBS1 | 582 | A_24_P184305 | -0.5186 | 0.2237 | |
| SRP007169 | BBS1 | 582 | RNAseq | 0.6004 | 0.1357 | |
| SRP008496 | BBS1 | 582 | RNAseq | 0.7176 | 0.0298 | |
| SRP064894 | BBS1 | 582 | RNAseq | -0.3851 | 0.0055 | |
| SRP133303 | BBS1 | 582 | RNAseq | -0.0512 | 0.7911 | |
| SRP159526 | BBS1 | 582 | RNAseq | 0.1974 | 0.5330 | |
| SRP193095 | BBS1 | 582 | RNAseq | 0.1337 | 0.0932 | |
| SRP219564 | BBS1 | 582 | RNAseq | -0.3484 | 0.4643 | |
| TCGA | BBS1 | 582 | RNAseq | -0.2981 | 0.0000 |
Upregulated datasets: 0; Downregulated datasets: 0.
Survival by BBS1 expression:
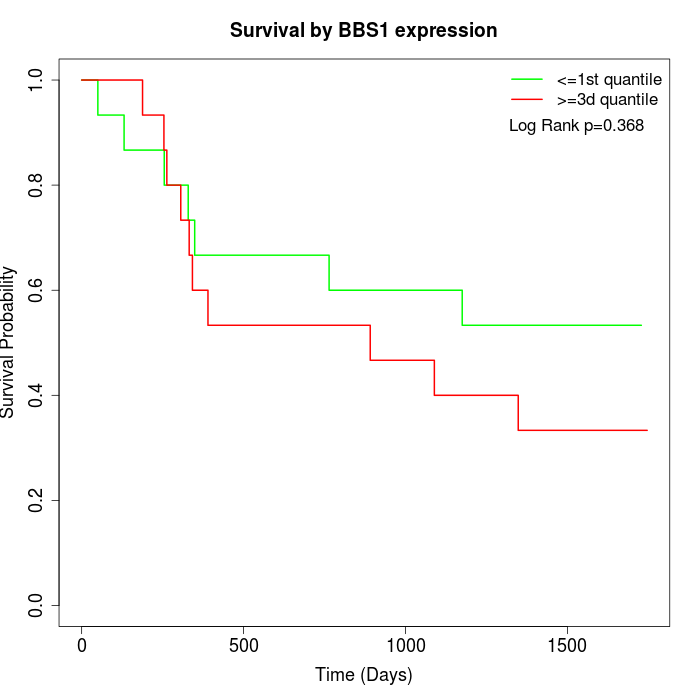 | 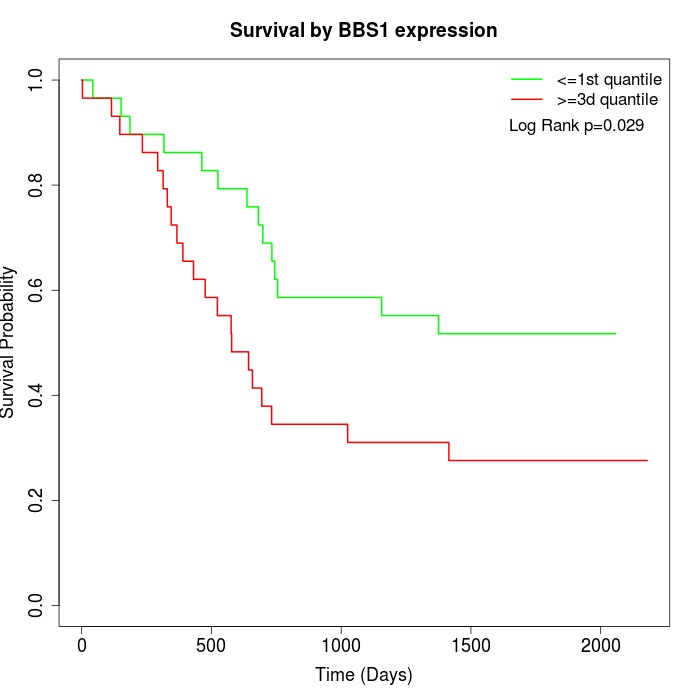 | 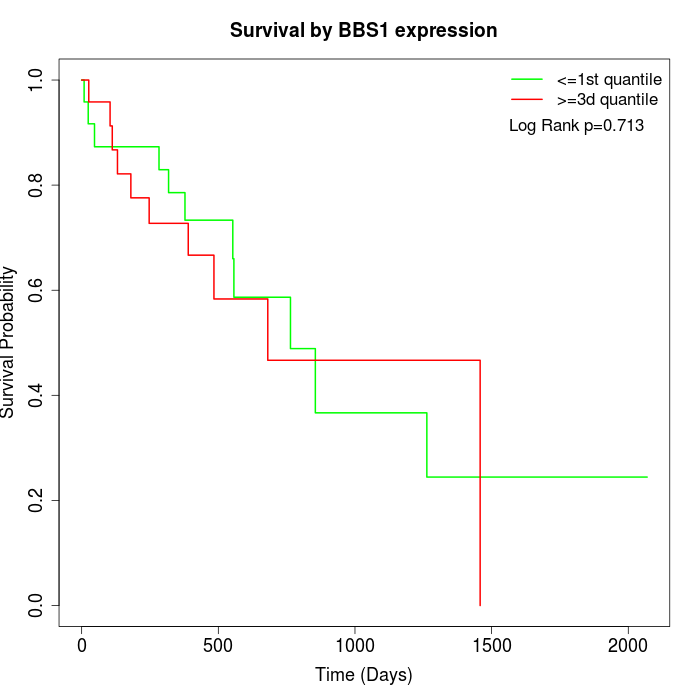 |
| GSE53622 | GSE53624 | TCGA |
Note: Click image to view full size file.
Copy number change of BBS1:
| Dataset | Gene | EntrezID | Gain | Loss | Normal | Detail |
|---|---|---|---|---|---|---|
| GSE15526 | BBS1 | 582 | 9 | 4 | 17 | |
| GSE20123 | BBS1 | 582 | 9 | 4 | 17 | |
| GSE43470 | BBS1 | 582 | 6 | 1 | 36 | |
| GSE46452 | BBS1 | 582 | 12 | 3 | 44 | |
| GSE47630 | BBS1 | 582 | 9 | 4 | 27 | |
| GSE54993 | BBS1 | 582 | 3 | 0 | 67 | |
| GSE54994 | BBS1 | 582 | 9 | 5 | 39 | |
| GSE60625 | BBS1 | 582 | 0 | 3 | 8 | |
| GSE74703 | BBS1 | 582 | 4 | 0 | 32 | |
| GSE74704 | BBS1 | 582 | 7 | 2 | 11 | |
| TCGA | BBS1 | 582 | 27 | 6 | 63 |
Total number of gains: 95; Total number of losses: 32; Total Number of normals: 361.
Somatic mutations of BBS1:
Generating mutation plots.
Highly correlated genes for BBS1:
Showing top 20/885 corelated genes with mean PCC>0.5.
| Gene1 | Gene2 | Mean PCC | Num. Datasets | Num. PCC<0 | Num. PCC>0.5 |
|---|---|---|---|---|---|
| BBS1 | CUEDC1 | 0.815173 | 3 | 0 | 3 |
| BBS1 | MSRB3 | 0.787975 | 3 | 0 | 3 |
| BBS1 | AP1S2 | 0.780299 | 5 | 0 | 5 |
| BBS1 | RPS24 | 0.765448 | 3 | 0 | 3 |
| BBS1 | NTN4 | 0.763018 | 4 | 0 | 4 |
| BBS1 | INMT | 0.760397 | 3 | 0 | 3 |
| BBS1 | TNFRSF19 | 0.759945 | 3 | 0 | 3 |
| BBS1 | PRELP | 0.752138 | 4 | 0 | 3 |
| BBS1 | CHN2 | 0.749239 | 3 | 0 | 3 |
| BBS1 | MCOLN3 | 0.747293 | 3 | 0 | 3 |
| BBS1 | MYOCD | 0.746317 | 3 | 0 | 3 |
| BBS1 | CFL2 | 0.745275 | 3 | 0 | 3 |
| BBS1 | GYPC | 0.745016 | 4 | 0 | 4 |
| BBS1 | PPP1R35 | 0.743147 | 3 | 0 | 3 |
| BBS1 | XKR4 | 0.741794 | 4 | 0 | 4 |
| BBS1 | NCOR1 | 0.737814 | 3 | 0 | 3 |
| BBS1 | CNRIP1 | 0.731561 | 3 | 0 | 3 |
| BBS1 | ZBTB16 | 0.730484 | 4 | 0 | 4 |
| BBS1 | BMP5 | 0.726675 | 3 | 0 | 3 |
| BBS1 | RPS9 | 0.726446 | 3 | 0 | 3 |
For details and further investigation, click here