| Full name: Bardet-Biedl syndrome 5 | Alias Symbol: DKFZp762I194 | ||
| Type: protein-coding gene | Cytoband: 2q31.1 | ||
| Entrez ID: 129880 | HGNC ID: HGNC:970 | Ensembl Gene: ENSG00000163093 | OMIM ID: 603650 |
Expression of BBS5:
| Dataset | Gene | EntrezID | Probe | Log2FC | Adj.pValue | Expression |
|---|---|---|---|---|---|---|
| GSE17351 | BBS5 | 129880 | 230697_at | 0.6022 | 0.4002 | |
| GSE26886 | BBS5 | 129880 | 230697_at | -0.0553 | 0.5482 | |
| GSE45670 | BBS5 | 129880 | 230697_at | 0.0476 | 0.7245 | |
| GSE53622 | BBS5 | 129880 | 50026 | 0.0756 | 0.5780 | |
| GSE53624 | BBS5 | 129880 | 50026 | 0.0868 | 0.3425 | |
| GSE63941 | BBS5 | 129880 | 230697_at | 0.3110 | 0.4209 | |
| GSE77861 | BBS5 | 129880 | 230697_at | 0.0384 | 0.6463 | |
| GSE97050 | BBS5 | 129880 | A_23_P252642 | 0.9217 | 0.0620 | |
| SRP007169 | BBS5 | 129880 | RNAseq | 1.9441 | 0.0003 | |
| SRP008496 | BBS5 | 129880 | RNAseq | 2.5403 | 0.0000 | |
| SRP064894 | BBS5 | 129880 | RNAseq | 0.5903 | 0.0066 | |
| SRP133303 | BBS5 | 129880 | RNAseq | 0.3003 | 0.0022 | |
| SRP159526 | BBS5 | 129880 | RNAseq | 1.3786 | 0.0000 | |
| SRP193095 | BBS5 | 129880 | RNAseq | 0.5502 | 0.0006 | |
| SRP219564 | BBS5 | 129880 | RNAseq | 0.2969 | 0.3732 | |
| TCGA | BBS5 | 129880 | RNAseq | -0.1447 | 0.1477 |
Upregulated datasets: 3; Downregulated datasets: 0.
Survival by BBS5 expression:
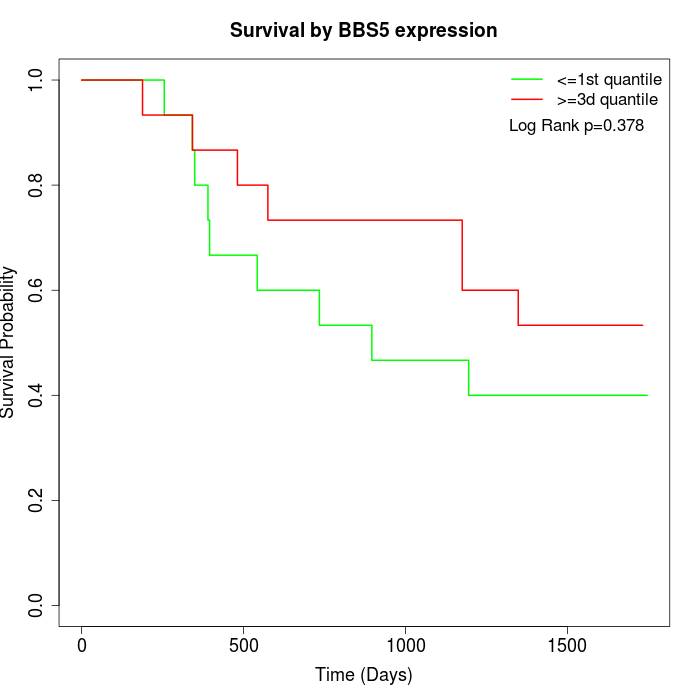 | 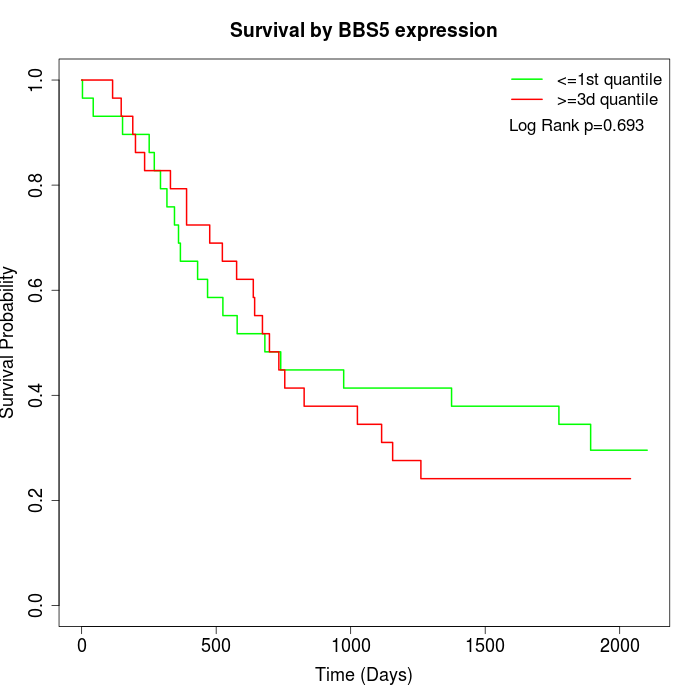 | 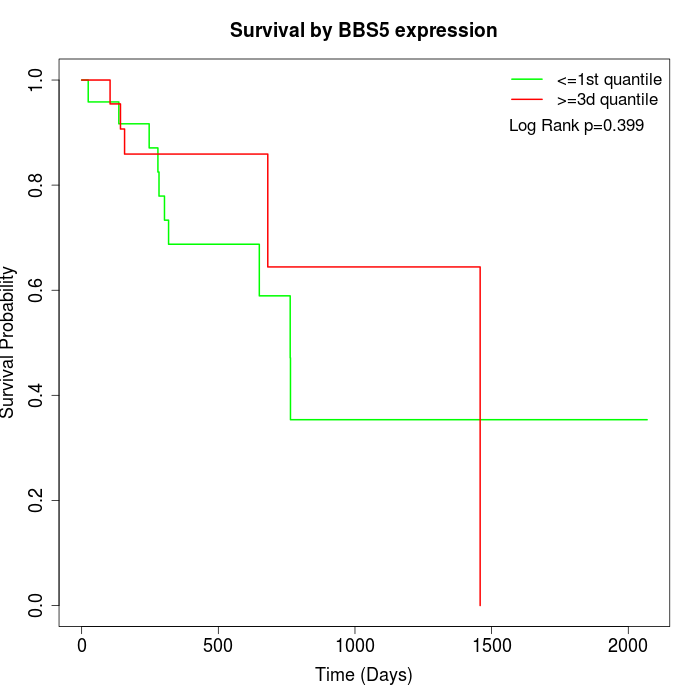 |
| GSE53622 | GSE53624 | TCGA |
Note: Click image to view full size file.
Copy number change of BBS5:
| Dataset | Gene | EntrezID | Gain | Loss | Normal | Detail |
|---|---|---|---|---|---|---|
| GSE15526 | BBS5 | 129880 | 8 | 0 | 22 | |
| GSE20123 | BBS5 | 129880 | 8 | 0 | 22 | |
| GSE43470 | BBS5 | 129880 | 5 | 1 | 37 | |
| GSE46452 | BBS5 | 129880 | 1 | 4 | 54 | |
| GSE47630 | BBS5 | 129880 | 5 | 3 | 32 | |
| GSE54993 | BBS5 | 129880 | 0 | 5 | 65 | |
| GSE54994 | BBS5 | 129880 | 11 | 3 | 39 | |
| GSE60625 | BBS5 | 129880 | 0 | 3 | 8 | |
| GSE74703 | BBS5 | 129880 | 4 | 1 | 31 | |
| GSE74704 | BBS5 | 129880 | 5 | 0 | 15 | |
| TCGA | BBS5 | 129880 | 24 | 10 | 62 |
Total number of gains: 71; Total number of losses: 30; Total Number of normals: 387.
Somatic mutations of BBS5:
Generating mutation plots.
Highly correlated genes for BBS5:
Showing top 20/33 corelated genes with mean PCC>0.5.
| Gene1 | Gene2 | Mean PCC | Num. Datasets | Num. PCC<0 | Num. PCC>0.5 |
|---|---|---|---|---|---|
| BBS5 | VGLL4 | 0.659121 | 3 | 0 | 3 |
| BBS5 | PAIP1 | 0.653693 | 3 | 0 | 3 |
| BBS5 | CANX | 0.647772 | 3 | 0 | 3 |
| BBS5 | XRCC3 | 0.645747 | 3 | 0 | 3 |
| BBS5 | ZNF765 | 0.636653 | 3 | 0 | 3 |
| BBS5 | PTMA | 0.634299 | 3 | 0 | 3 |
| BBS5 | UXS1 | 0.627612 | 3 | 0 | 3 |
| BBS5 | PPP6R1 | 0.625724 | 3 | 0 | 3 |
| BBS5 | NAA50 | 0.62114 | 3 | 0 | 3 |
| BBS5 | ATP6V1C1 | 0.617072 | 3 | 0 | 3 |
| BBS5 | CEP128 | 0.597391 | 3 | 0 | 3 |
| BBS5 | HCLS1 | 0.595134 | 3 | 0 | 3 |
| BBS5 | APEX1 | 0.594047 | 5 | 0 | 4 |
| BBS5 | PLAG1 | 0.58712 | 3 | 0 | 3 |
| BBS5 | ZNF22 | 0.571139 | 4 | 0 | 3 |
| BBS5 | NUDCD1 | 0.568392 | 3 | 0 | 3 |
| BBS5 | TBPL1 | 0.562443 | 3 | 0 | 3 |
| BBS5 | HDAC2 | 0.562343 | 3 | 0 | 3 |
| BBS5 | BRMS1L | 0.561166 | 6 | 0 | 4 |
| BBS5 | PSAP | 0.560035 | 4 | 0 | 3 |
For details and further investigation, click here