| Full name: N(alpha)-acetyltransferase 50, NatE catalytic subunit | Alias Symbol: FLJ13194|NAT5|San | ||
| Type: protein-coding gene | Cytoband: 3q13.31 | ||
| Entrez ID: 80218 | HGNC ID: HGNC:29533 | Ensembl Gene: ENSG00000121579 | OMIM ID: 610834 |
Screen Evidence:
| |||
Expression of NAA50:
| Dataset | Gene | EntrezID | Probe | Log2FC | Adj.pValue | Expression |
|---|---|---|---|---|---|---|
| GSE17351 | NAA50 | 80218 | 217745_s_at | 0.4703 | 0.2009 | |
| GSE20347 | NAA50 | 80218 | 217745_s_at | 0.5077 | 0.0001 | |
| GSE23400 | NAA50 | 80218 | 217745_s_at | 0.5023 | 0.0000 | |
| GSE26886 | NAA50 | 80218 | 217745_s_at | -0.3638 | 0.0365 | |
| GSE29001 | NAA50 | 80218 | 217745_s_at | 0.5054 | 0.2653 | |
| GSE38129 | NAA50 | 80218 | 217745_s_at | 0.5111 | 0.0001 | |
| GSE45670 | NAA50 | 80218 | 217745_s_at | 0.3635 | 0.0151 | |
| GSE53622 | NAA50 | 80218 | 41606 | 0.4640 | 0.0000 | |
| GSE53624 | NAA50 | 80218 | 1765 | -0.0339 | 0.6321 | |
| GSE63941 | NAA50 | 80218 | 217745_s_at | -0.1591 | 0.6729 | |
| GSE77861 | NAA50 | 80218 | 217745_s_at | 0.2216 | 0.6255 | |
| GSE97050 | NAA50 | 80218 | A_33_P3225587 | 0.7789 | 0.0736 | |
| SRP007169 | NAA50 | 80218 | RNAseq | 1.6285 | 0.0074 | |
| SRP008496 | NAA50 | 80218 | RNAseq | 1.5776 | 0.0000 | |
| SRP064894 | NAA50 | 80218 | RNAseq | 0.3505 | 0.0621 | |
| SRP133303 | NAA50 | 80218 | RNAseq | 0.5315 | 0.0362 | |
| SRP159526 | NAA50 | 80218 | RNAseq | 0.4112 | 0.1538 | |
| SRP193095 | NAA50 | 80218 | RNAseq | 0.2968 | 0.0323 | |
| SRP219564 | NAA50 | 80218 | RNAseq | 0.0842 | 0.7706 | |
| TCGA | NAA50 | 80218 | RNAseq | 0.1611 | 0.0007 |
Upregulated datasets: 2; Downregulated datasets: 0.
Survival by NAA50 expression:
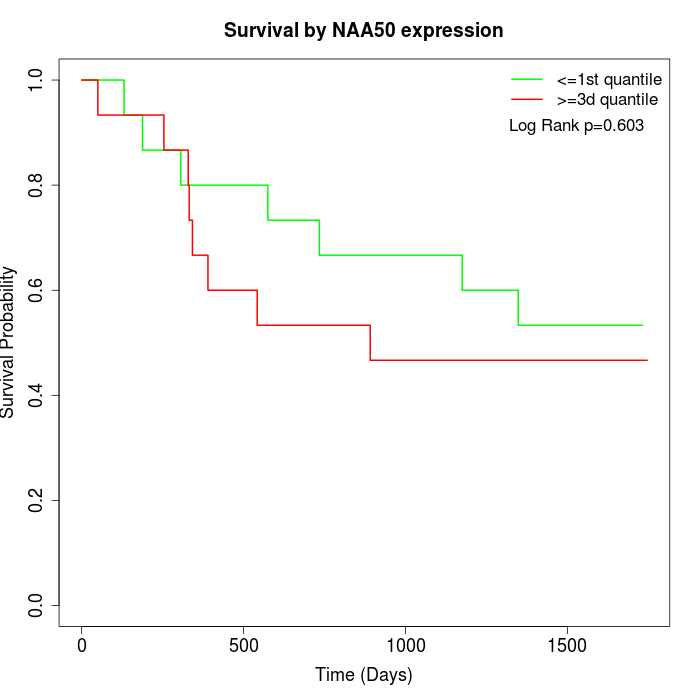 | 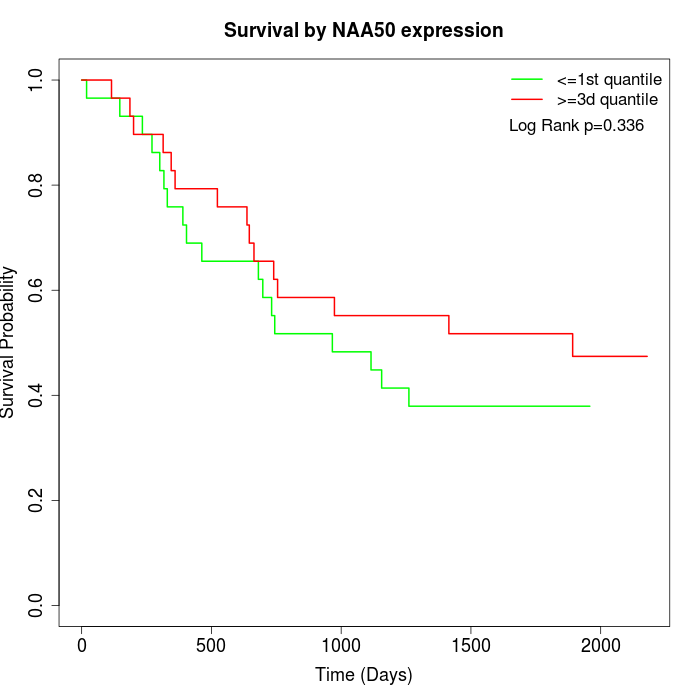 | 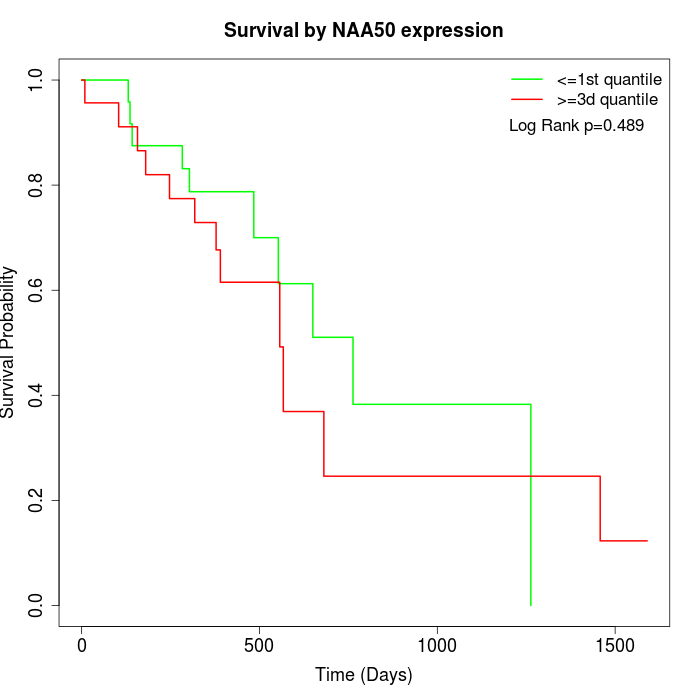 |
| GSE53622 | GSE53624 | TCGA |
Note: Click image to view full size file.
Copy number change of NAA50:
| Dataset | Gene | EntrezID | Gain | Loss | Normal | Detail |
|---|---|---|---|---|---|---|
| GSE15526 | NAA50 | 80218 | 16 | 1 | 13 | |
| GSE20123 | NAA50 | 80218 | 16 | 1 | 13 | |
| GSE43470 | NAA50 | 80218 | 21 | 1 | 21 | |
| GSE46452 | NAA50 | 80218 | 13 | 5 | 41 | |
| GSE47630 | NAA50 | 80218 | 16 | 6 | 18 | |
| GSE54993 | NAA50 | 80218 | 2 | 6 | 62 | |
| GSE54994 | NAA50 | 80218 | 29 | 4 | 20 | |
| GSE60625 | NAA50 | 80218 | 0 | 6 | 5 | |
| GSE74703 | NAA50 | 80218 | 17 | 1 | 18 | |
| GSE74704 | NAA50 | 80218 | 12 | 1 | 7 | |
| TCGA | NAA50 | 80218 | 52 | 7 | 37 |
Total number of gains: 194; Total number of losses: 39; Total Number of normals: 255.
Somatic mutations of NAA50:
Generating mutation plots.
Highly correlated genes for NAA50:
Showing top 20/885 corelated genes with mean PCC>0.5.
| Gene1 | Gene2 | Mean PCC | Num. Datasets | Num. PCC<0 | Num. PCC>0.5 |
|---|---|---|---|---|---|
| NAA50 | ARF3 | 0.829024 | 3 | 0 | 3 |
| NAA50 | TMEM160 | 0.802466 | 3 | 0 | 3 |
| NAA50 | ATG3 | 0.763678 | 11 | 0 | 10 |
| NAA50 | ALG1 | 0.751575 | 4 | 0 | 4 |
| NAA50 | ZBTB9 | 0.749376 | 3 | 0 | 3 |
| NAA50 | TIMMDC1 | 0.744811 | 5 | 0 | 5 |
| NAA50 | ZNF765 | 0.734631 | 3 | 0 | 3 |
| NAA50 | NEDD1 | 0.732694 | 3 | 0 | 3 |
| NAA50 | LRRC58 | 0.728797 | 5 | 0 | 5 |
| NAA50 | CLIC1 | 0.726613 | 3 | 0 | 3 |
| NAA50 | UMPS | 0.725216 | 10 | 0 | 9 |
| NAA50 | PIK3R4 | 0.716256 | 10 | 0 | 9 |
| NAA50 | ZNF485 | 0.71527 | 3 | 0 | 3 |
| NAA50 | CENPBD1 | 0.71178 | 4 | 0 | 4 |
| NAA50 | TOPBP1 | 0.708399 | 9 | 0 | 9 |
| NAA50 | CALML5 | 0.702311 | 4 | 0 | 3 |
| NAA50 | GET4 | 0.693685 | 3 | 0 | 3 |
| NAA50 | C2CD2 | 0.691706 | 3 | 0 | 3 |
| NAA50 | DBF4 | 0.68712 | 7 | 0 | 7 |
| NAA50 | ATP2A2 | 0.68444 | 6 | 0 | 6 |
For details and further investigation, click here