| Full name: prothymosin alpha | Alias Symbol: | ||
| Type: protein-coding gene | Cytoband: 2q37.1 | ||
| Entrez ID: 5757 | HGNC ID: HGNC:9623 | Ensembl Gene: ENSG00000187514 | OMIM ID: 188390 |
| Related drugs: THYMALFASIN... [more] | |||
Screen Evidence:
| |||
Expression of PTMA:
| Dataset | Gene | EntrezID | Probe | Log2FC | Adj.pValue | Expression |
|---|---|---|---|---|---|---|
| GSE17351 | PTMA | 5757 | 200773_x_at | 0.1219 | 0.5703 | |
| GSE20347 | PTMA | 5757 | 200773_x_at | 0.2601 | 0.0027 | |
| GSE23400 | PTMA | 5757 | 200773_x_at | 0.3071 | 0.0000 | |
| GSE26886 | PTMA | 5757 | 200773_x_at | -0.3184 | 0.0231 | |
| GSE29001 | PTMA | 5757 | 200773_x_at | 0.2159 | 0.1713 | |
| GSE38129 | PTMA | 5757 | 200773_x_at | 0.2129 | 0.0091 | |
| GSE45670 | PTMA | 5757 | 200773_x_at | 0.0399 | 0.7433 | |
| GSE53622 | PTMA | 5757 | 118961 | 0.4834 | 0.0000 | |
| GSE53624 | PTMA | 5757 | 118961 | 0.7193 | 0.0000 | |
| GSE63941 | PTMA | 5757 | 200773_x_at | 0.2496 | 0.3773 | |
| GSE77861 | PTMA | 5757 | 200773_x_at | 0.0984 | 0.3605 | |
| GSE97050 | PTMA | A_21_P0013910 | 0.8607 | 0.0635 | ||
| SRP007169 | PTMA | 5757 | RNAseq | 0.6694 | 0.0923 | |
| SRP008496 | PTMA | 5757 | RNAseq | 0.8922 | 0.0014 | |
| SRP064894 | PTMA | 5757 | RNAseq | 0.2302 | 0.1255 | |
| SRP133303 | PTMA | 5757 | RNAseq | 0.4340 | 0.0024 | |
| SRP159526 | PTMA | 5757 | RNAseq | 0.4663 | 0.0771 | |
| SRP193095 | PTMA | 5757 | RNAseq | -0.0203 | 0.8733 | |
| SRP219564 | PTMA | 5757 | RNAseq | 0.2798 | 0.2863 | |
| TCGA | PTMA | 5757 | RNAseq | 0.1088 | 0.0063 |
Upregulated datasets: 0; Downregulated datasets: 0.
Survival by PTMA expression:
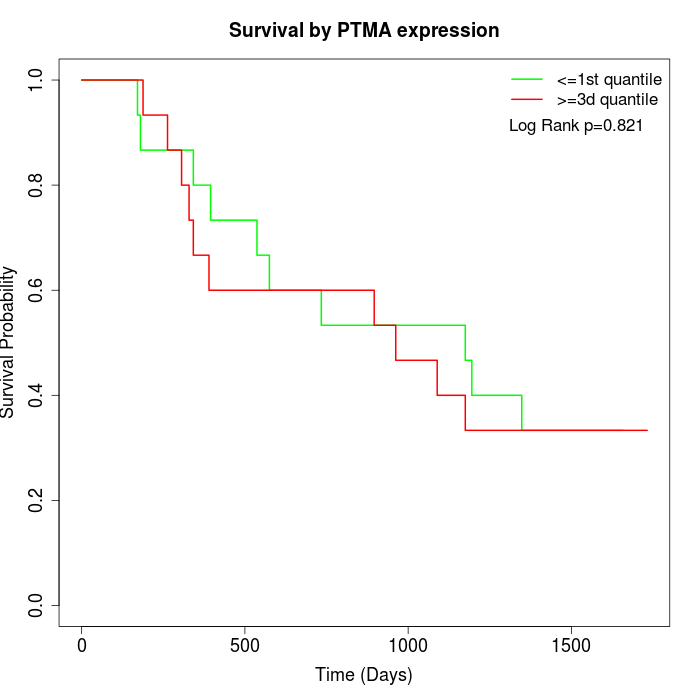 | 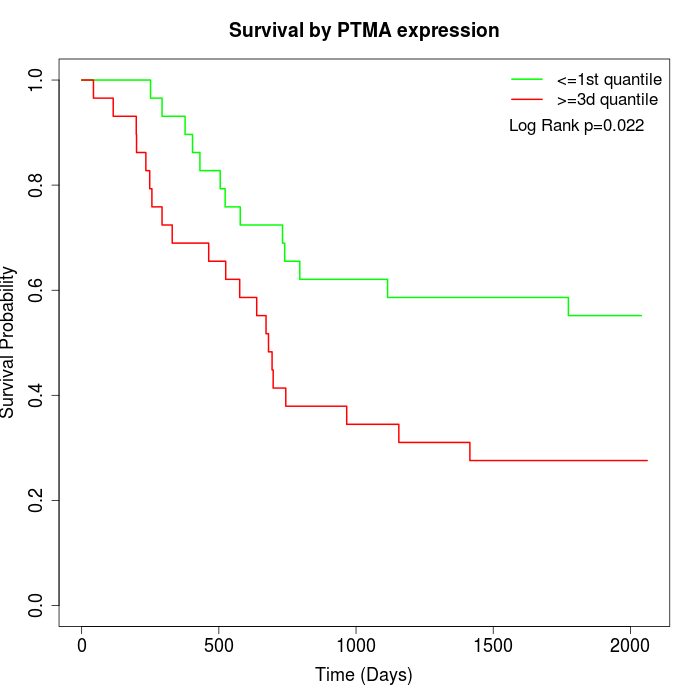 | 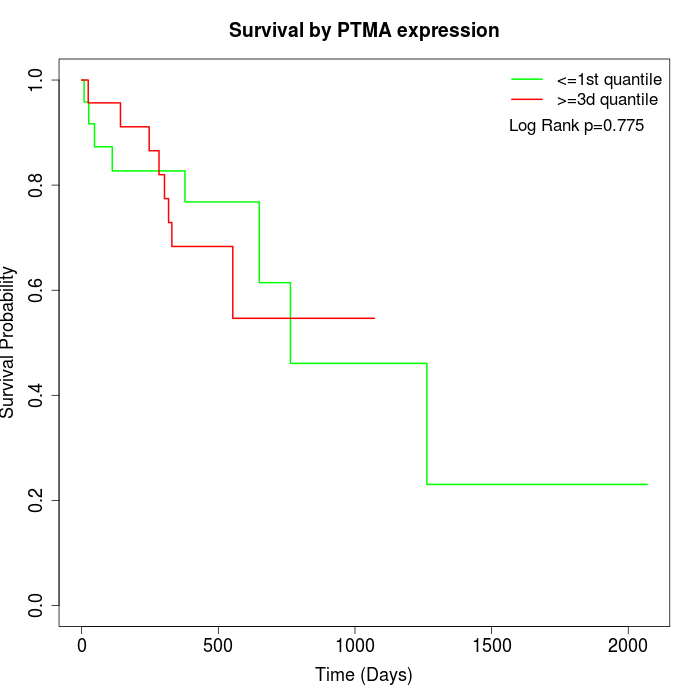 |
| GSE53622 | GSE53624 | TCGA |
Note: Click image to view full size file.
Copy number change of PTMA:
| Dataset | Gene | EntrezID | Gain | Loss | Normal | Detail |
|---|---|---|---|---|---|---|
| GSE15526 | PTMA | 5757 | 1 | 12 | 17 | |
| GSE20123 | PTMA | 5757 | 1 | 12 | 17 | |
| GSE43470 | PTMA | 5757 | 1 | 8 | 34 | |
| GSE46452 | PTMA | 5757 | 0 | 5 | 54 | |
| GSE47630 | PTMA | 5757 | 4 | 5 | 31 | |
| GSE54993 | PTMA | 5757 | 2 | 2 | 66 | |
| GSE54994 | PTMA | 5757 | 6 | 10 | 37 | |
| GSE60625 | PTMA | 5757 | 0 | 3 | 8 | |
| GSE74703 | PTMA | 5757 | 1 | 6 | 29 | |
| GSE74704 | PTMA | 5757 | 1 | 5 | 14 | |
| TCGA | PTMA | 5757 | 12 | 27 | 57 |
Total number of gains: 29; Total number of losses: 95; Total Number of normals: 364.
Somatic mutations of PTMA:
Generating mutation plots.
Highly correlated genes for PTMA:
Showing top 20/333 corelated genes with mean PCC>0.5.
| Gene1 | Gene2 | Mean PCC | Num. Datasets | Num. PCC<0 | Num. PCC>0.5 |
|---|---|---|---|---|---|
| PTMA | MIR1244-3 | 0.901807 | 9 | 0 | 9 |
| PTMA | C19orf53 | 0.655162 | 3 | 0 | 3 |
| PTMA | NAT14 | 0.640849 | 3 | 0 | 3 |
| PTMA | TMEM205 | 0.636386 | 3 | 0 | 3 |
| PTMA | BBS5 | 0.634299 | 3 | 0 | 3 |
| PTMA | HNRNPR | 0.630724 | 7 | 0 | 5 |
| PTMA | PDHA1 | 0.629278 | 3 | 0 | 3 |
| PTMA | RCC2 | 0.6263 | 4 | 0 | 4 |
| PTMA | SNAP47 | 0.620086 | 3 | 0 | 3 |
| PTMA | RBBP4 | 0.614195 | 11 | 0 | 9 |
| PTMA | BTBD3 | 0.613258 | 5 | 0 | 3 |
| PTMA | TTYH3 | 0.604028 | 4 | 0 | 3 |
| PTMA | PRKDC | 0.602342 | 7 | 0 | 7 |
| PTMA | ARL3 | 0.594923 | 4 | 0 | 4 |
| PTMA | HSP90B1 | 0.593526 | 6 | 0 | 5 |
| PTMA | HMGB1 | 0.592533 | 10 | 0 | 8 |
| PTMA | POT1 | 0.591527 | 7 | 0 | 5 |
| PTMA | HNRNPA2B1 | 0.590724 | 10 | 0 | 7 |
| PTMA | PCNA | 0.588892 | 9 | 0 | 7 |
| PTMA | CNNM3 | 0.587035 | 4 | 0 | 3 |
For details and further investigation, click here