| Full name: BMS1 ribosome biogenesis factor | Alias Symbol: KIAA0187 | ||
| Type: protein-coding gene | Cytoband: 10q11.21 | ||
| Entrez ID: 9790 | HGNC ID: HGNC:23505 | Ensembl Gene: ENSG00000165733 | OMIM ID: 611448 |
Screen Evidence:
| |||
Expression of BMS1:
| Dataset | Gene | EntrezID | Probe | Log2FC | Adj.pValue | Expression |
|---|---|---|---|---|---|---|
| GSE17351 | BMS1 | 9790 | 203082_at | 0.4982 | 0.1231 | |
| GSE20347 | BMS1 | 9790 | 203082_at | 0.5109 | 0.0027 | |
| GSE23400 | BMS1 | 9790 | 203082_at | 0.5418 | 0.0000 | |
| GSE26886 | BMS1 | 9790 | 203082_at | 0.9529 | 0.0000 | |
| GSE29001 | BMS1 | 9790 | 203082_at | 0.3313 | 0.0818 | |
| GSE38129 | BMS1 | 9790 | 203082_at | 0.4847 | 0.0000 | |
| GSE45670 | BMS1 | 9790 | 203082_at | 0.4902 | 0.0010 | |
| GSE63941 | BMS1 | 9790 | 203082_at | 0.2283 | 0.4046 | |
| GSE77861 | BMS1 | 9790 | 203082_at | 0.5816 | 0.0052 | |
| GSE97050 | BMS1 | 9790 | A_24_P263672 | -0.9265 | 0.1976 | |
| SRP007169 | BMS1 | 9790 | RNAseq | 0.2593 | 0.6207 | |
| SRP008496 | BMS1 | 9790 | RNAseq | 0.6351 | 0.0904 | |
| SRP064894 | BMS1 | 9790 | RNAseq | 0.1510 | 0.1003 | |
| SRP133303 | BMS1 | 9790 | RNAseq | 0.4666 | 0.0008 | |
| SRP159526 | BMS1 | 9790 | RNAseq | -0.0010 | 0.9969 | |
| SRP193095 | BMS1 | 9790 | RNAseq | 0.2935 | 0.0002 | |
| SRP219564 | BMS1 | 9790 | RNAseq | 0.3723 | 0.2391 | |
| TCGA | BMS1 | 9790 | RNAseq | 0.1253 | 0.0087 |
Upregulated datasets: 0; Downregulated datasets: 0.
Survival by BMS1 expression:
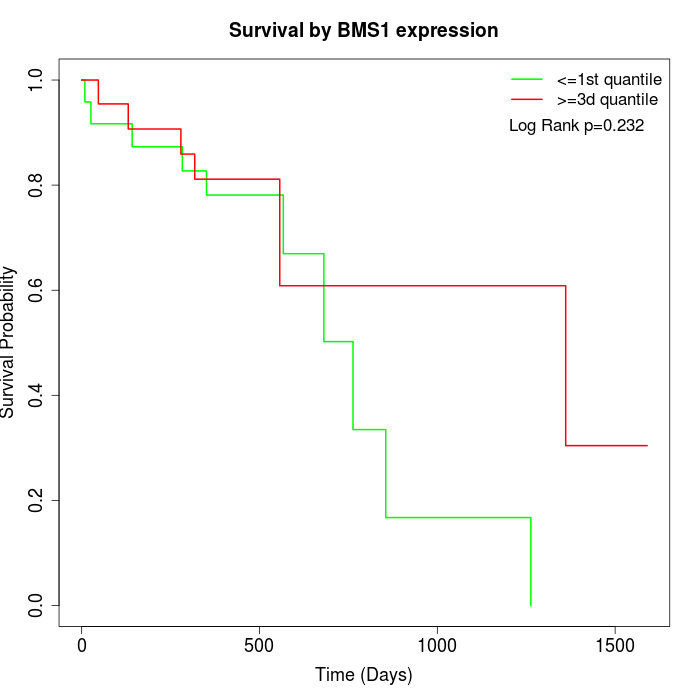 |
| TCGA |
Note: Click image to view full size file.
Copy number change of BMS1:
| Dataset | Gene | EntrezID | Gain | Loss | Normal | Detail |
|---|---|---|---|---|---|---|
| GSE15526 | BMS1 | 9790 | 3 | 5 | 22 | |
| GSE20123 | BMS1 | 9790 | 4 | 4 | 22 | |
| GSE43470 | BMS1 | 9790 | 1 | 6 | 36 | |
| GSE46452 | BMS1 | 9790 | 0 | 13 | 46 | |
| GSE47630 | BMS1 | 9790 | 4 | 12 | 24 | |
| GSE54993 | BMS1 | 9790 | 9 | 0 | 61 | |
| GSE54994 | BMS1 | 9790 | 2 | 10 | 41 | |
| GSE60625 | BMS1 | 9790 | 0 | 0 | 11 | |
| GSE74703 | BMS1 | 9790 | 1 | 3 | 32 | |
| GSE74704 | BMS1 | 9790 | 2 | 3 | 15 | |
| TCGA | BMS1 | 9790 | 15 | 19 | 62 |
Total number of gains: 41; Total number of losses: 75; Total Number of normals: 372.
Somatic mutations of BMS1:
Generating mutation plots.
Highly correlated genes for BMS1:
Showing top 20/1203 corelated genes with mean PCC>0.5.
| Gene1 | Gene2 | Mean PCC | Num. Datasets | Num. PCC<0 | Num. PCC>0.5 |
|---|---|---|---|---|---|
| BMS1 | WDR66 | 0.766218 | 4 | 0 | 4 |
| BMS1 | NIFK | 0.765398 | 4 | 0 | 4 |
| BMS1 | FAM91A1 | 0.755544 | 3 | 0 | 3 |
| BMS1 | NSUN2 | 0.754034 | 4 | 0 | 4 |
| BMS1 | TOP1MT | 0.750355 | 4 | 0 | 4 |
| BMS1 | MED10 | 0.739734 | 3 | 0 | 3 |
| BMS1 | NOP58 | 0.738713 | 4 | 0 | 4 |
| BMS1 | CMSS1 | 0.735475 | 4 | 0 | 4 |
| BMS1 | ACBD6 | 0.730476 | 3 | 0 | 3 |
| BMS1 | PAPOLA | 0.730163 | 4 | 0 | 4 |
| BMS1 | FMNL2 | 0.724472 | 4 | 0 | 4 |
| BMS1 | DDX55 | 0.721678 | 5 | 0 | 4 |
| BMS1 | TIGD1 | 0.718254 | 3 | 0 | 3 |
| BMS1 | DERL1 | 0.715124 | 5 | 0 | 5 |
| BMS1 | BOD1 | 0.71477 | 3 | 0 | 3 |
| BMS1 | TYW5 | 0.713589 | 3 | 0 | 3 |
| BMS1 | YWHAG | 0.712015 | 4 | 0 | 4 |
| BMS1 | RIOK1 | 0.710471 | 4 | 0 | 4 |
| BMS1 | CCM2 | 0.708337 | 4 | 0 | 4 |
| BMS1 | ITM2C | 0.707444 | 3 | 0 | 3 |
For details and further investigation, click here