| Full name: bromodomain containing 9 | Alias Symbol: FLJ13441 | ||
| Type: protein-coding gene | Cytoband: 5p15.33 | ||
| Entrez ID: 65980 | HGNC ID: HGNC:25818 | Ensembl Gene: ENSG00000028310 | OMIM ID: |
Screen Evidence:
| |||
Expression of BRD9:
| Dataset | Gene | EntrezID | Probe | Log2FC | Adj.pValue | Expression |
|---|---|---|---|---|---|---|
| GSE17351 | BRD9 | 65980 | 220155_s_at | 0.6723 | 0.0519 | |
| GSE20347 | BRD9 | 65980 | 220155_s_at | 0.5402 | 0.0001 | |
| GSE23400 | BRD9 | 65980 | 220155_s_at | 0.3461 | 0.0000 | |
| GSE26886 | BRD9 | 65980 | 220155_s_at | 0.7419 | 0.0000 | |
| GSE29001 | BRD9 | 65980 | 220155_s_at | 0.5064 | 0.1107 | |
| GSE38129 | BRD9 | 65980 | 220155_s_at | 0.4452 | 0.0001 | |
| GSE45670 | BRD9 | 65980 | 220155_s_at | 0.3469 | 0.0174 | |
| GSE53622 | BRD9 | 65980 | 116573 | 0.3764 | 0.0000 | |
| GSE53624 | BRD9 | 65980 | 116573 | 0.5068 | 0.0000 | |
| GSE63941 | BRD9 | 65980 | 220155_s_at | -0.0863 | 0.8257 | |
| GSE77861 | BRD9 | 65980 | 220155_s_at | 0.3152 | 0.0769 | |
| GSE97050 | BRD9 | 65980 | A_23_P19004 | 0.3097 | 0.2237 | |
| SRP007169 | BRD9 | 65980 | RNAseq | 1.3907 | 0.0034 | |
| SRP008496 | BRD9 | 65980 | RNAseq | 0.9971 | 0.0050 | |
| SRP064894 | BRD9 | 65980 | RNAseq | 0.4381 | 0.0013 | |
| SRP133303 | BRD9 | 65980 | RNAseq | 0.5339 | 0.0099 | |
| SRP159526 | BRD9 | 65980 | RNAseq | 0.5093 | 0.1275 | |
| SRP193095 | BRD9 | 65980 | RNAseq | 0.6973 | 0.0000 | |
| SRP219564 | BRD9 | 65980 | RNAseq | 0.9486 | 0.0549 | |
| TCGA | BRD9 | 65980 | RNAseq | 0.1055 | 0.0855 |
Upregulated datasets: 1; Downregulated datasets: 0.
Survival by BRD9 expression:
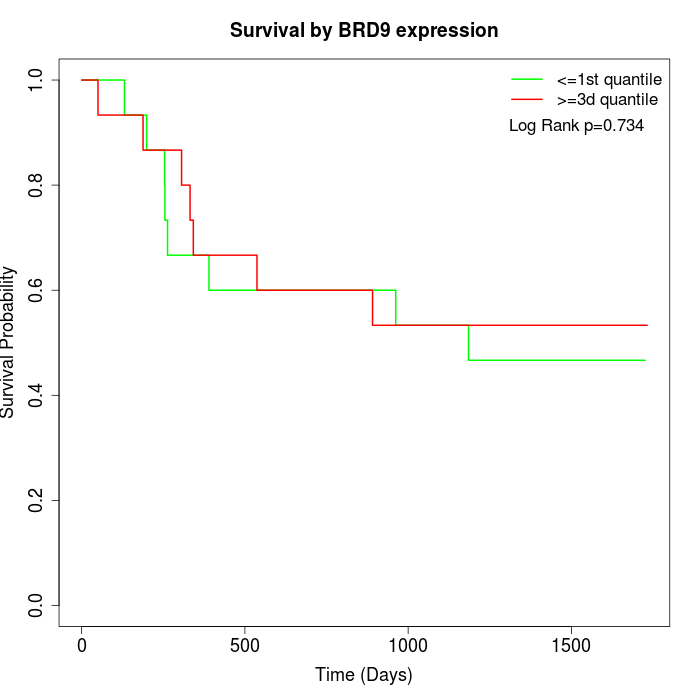 | 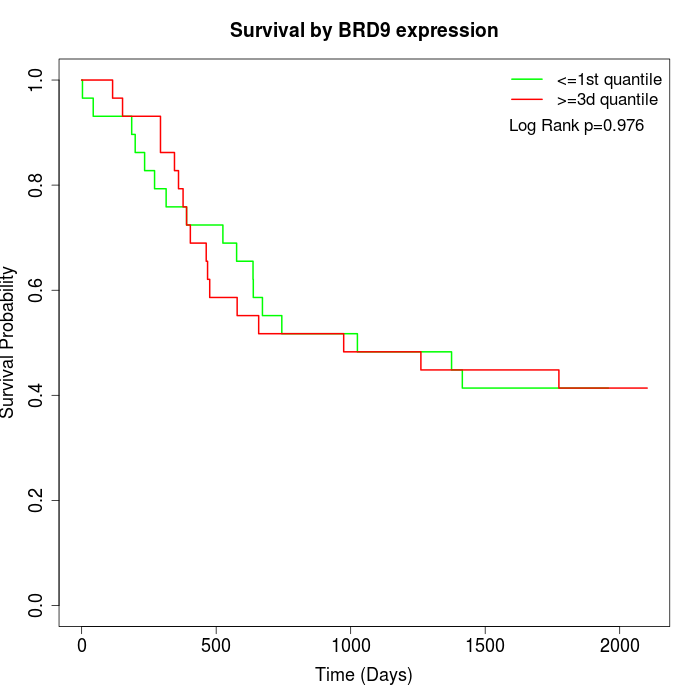 | 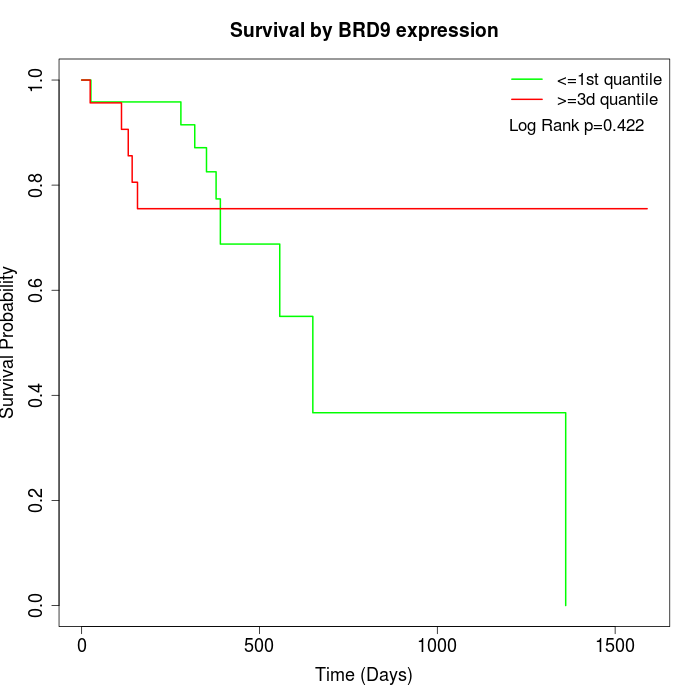 |
| GSE53622 | GSE53624 | TCGA |
Note: Click image to view full size file.
Copy number change of BRD9:
| Dataset | Gene | EntrezID | Gain | Loss | Normal | Detail |
|---|---|---|---|---|---|---|
| GSE15526 | BRD9 | 65980 | 13 | 1 | 16 | |
| GSE20123 | BRD9 | 65980 | 13 | 1 | 16 | |
| GSE43470 | BRD9 | 65980 | 17 | 1 | 25 | |
| GSE46452 | BRD9 | 65980 | 6 | 22 | 31 | |
| GSE47630 | BRD9 | 65980 | 10 | 10 | 20 | |
| GSE54993 | BRD9 | 65980 | 5 | 6 | 59 | |
| GSE54994 | BRD9 | 65980 | 29 | 1 | 23 | |
| GSE60625 | BRD9 | 65980 | 0 | 0 | 11 | |
| GSE74703 | BRD9 | 65980 | 14 | 0 | 22 | |
| GSE74704 | BRD9 | 65980 | 11 | 0 | 9 | |
| TCGA | BRD9 | 65980 | 60 | 4 | 32 |
Total number of gains: 178; Total number of losses: 46; Total Number of normals: 264.
Somatic mutations of BRD9:
Generating mutation plots.
Highly correlated genes for BRD9:
Showing top 20/1298 corelated genes with mean PCC>0.5.
| Gene1 | Gene2 | Mean PCC | Num. Datasets | Num. PCC<0 | Num. PCC>0.5 |
|---|---|---|---|---|---|
| BRD9 | ACBD6 | 0.819314 | 3 | 0 | 3 |
| BRD9 | TSEN34 | 0.802052 | 3 | 0 | 3 |
| BRD9 | LRRC69 | 0.801713 | 3 | 0 | 3 |
| BRD9 | PDCD2L | 0.795819 | 3 | 0 | 3 |
| BRD9 | VPS13C | 0.784491 | 3 | 0 | 3 |
| BRD9 | ZNF584 | 0.779679 | 3 | 0 | 3 |
| BRD9 | SLC36A4 | 0.771133 | 3 | 0 | 3 |
| BRD9 | SLC39A3 | 0.763842 | 4 | 0 | 3 |
| BRD9 | CCNK | 0.760667 | 3 | 0 | 3 |
| BRD9 | TCF7L2 | 0.759505 | 3 | 0 | 3 |
| BRD9 | SPIRE2 | 0.759015 | 3 | 0 | 3 |
| BRD9 | WDR81 | 0.756863 | 4 | 0 | 4 |
| BRD9 | SLC25A29 | 0.754309 | 3 | 0 | 3 |
| BRD9 | ICE1 | 0.752576 | 8 | 0 | 8 |
| BRD9 | SETD5 | 0.744204 | 3 | 0 | 3 |
| BRD9 | GBP5 | 0.743298 | 3 | 0 | 3 |
| BRD9 | SLC37A3 | 0.734884 | 3 | 0 | 3 |
| BRD9 | SSBP4 | 0.734719 | 4 | 0 | 3 |
| BRD9 | KCNE3 | 0.733127 | 3 | 0 | 3 |
| BRD9 | INPP4A | 0.732959 | 3 | 0 | 3 |
For details and further investigation, click here