| Full name: chromosome 1 open reading frame 159 | Alias Symbol: FLJ20584 | ||
| Type: protein-coding gene | Cytoband: 1p36.33 | ||
| Entrez ID: 54991 | HGNC ID: HGNC:26062 | Ensembl Gene: ENSG00000131591 | OMIM ID: |
Expression of C1orf159:
| Dataset | Gene | EntrezID | Probe | Log2FC | Adj.pValue | Expression |
|---|---|---|---|---|---|---|
| GSE17351 | C1orf159 | 54991 | 219337_at | 0.3216 | 0.4729 | |
| GSE20347 | C1orf159 | 54991 | 219337_at | 0.1944 | 0.1170 | |
| GSE23400 | C1orf159 | 54991 | 219337_at | 0.1287 | 0.0043 | |
| GSE26886 | C1orf159 | 54991 | 219337_at | 0.3198 | 0.0129 | |
| GSE29001 | C1orf159 | 54991 | 219337_at | 0.0661 | 0.7402 | |
| GSE38129 | C1orf159 | 54991 | 219337_at | 0.2135 | 0.0320 | |
| GSE45670 | C1orf159 | 54991 | 219337_at | 0.1426 | 0.3060 | |
| GSE53622 | C1orf159 | 54991 | 22188 | 0.3557 | 0.0027 | |
| GSE53624 | C1orf159 | 54991 | 113644 | 0.5764 | 0.0000 | |
| GSE63941 | C1orf159 | 54991 | 219337_at | 0.2783 | 0.2534 | |
| GSE77861 | C1orf159 | 54991 | 219337_at | -0.1341 | 0.3050 | |
| GSE97050 | C1orf159 | 54991 | A_33_P3299081 | 0.1019 | 0.6847 | |
| SRP007169 | C1orf159 | 54991 | RNAseq | -0.5700 | 0.2724 | |
| SRP064894 | C1orf159 | 54991 | RNAseq | 0.4938 | 0.0673 | |
| SRP133303 | C1orf159 | 54991 | RNAseq | 0.0082 | 0.9684 | |
| SRP159526 | C1orf159 | 54991 | RNAseq | 0.4807 | 0.3338 | |
| SRP193095 | C1orf159 | 54991 | RNAseq | 0.2145 | 0.0699 | |
| SRP219564 | C1orf159 | 54991 | RNAseq | 0.1408 | 0.7424 | |
| TCGA | C1orf159 | 54991 | RNAseq | 0.1925 | 0.0061 |
Upregulated datasets: 0; Downregulated datasets: 0.
Survival by C1orf159 expression:
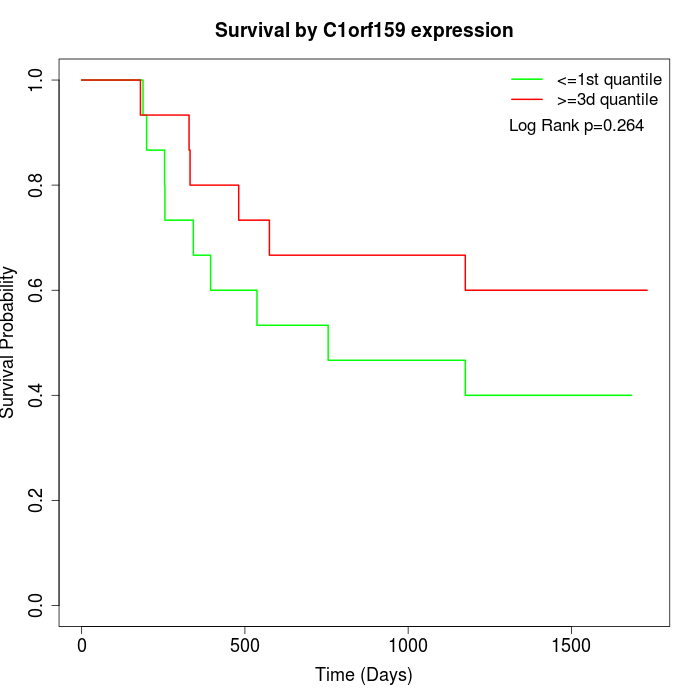 | 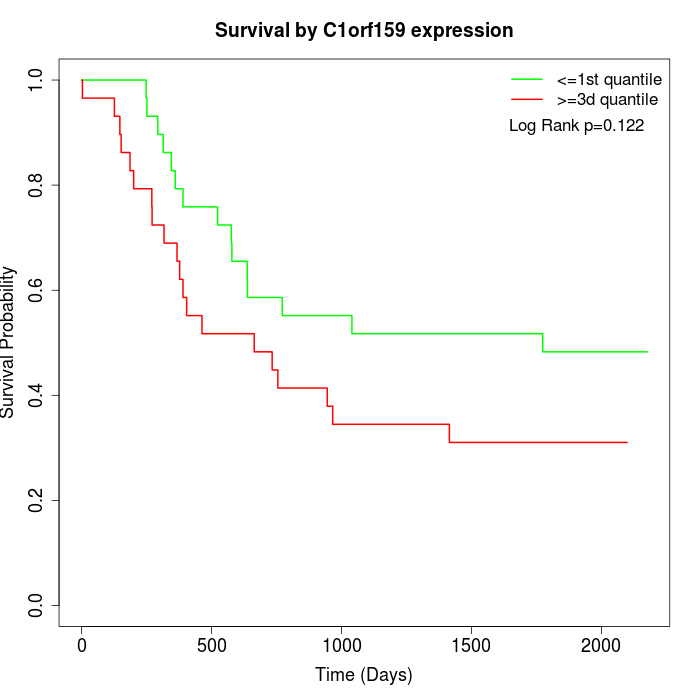 | 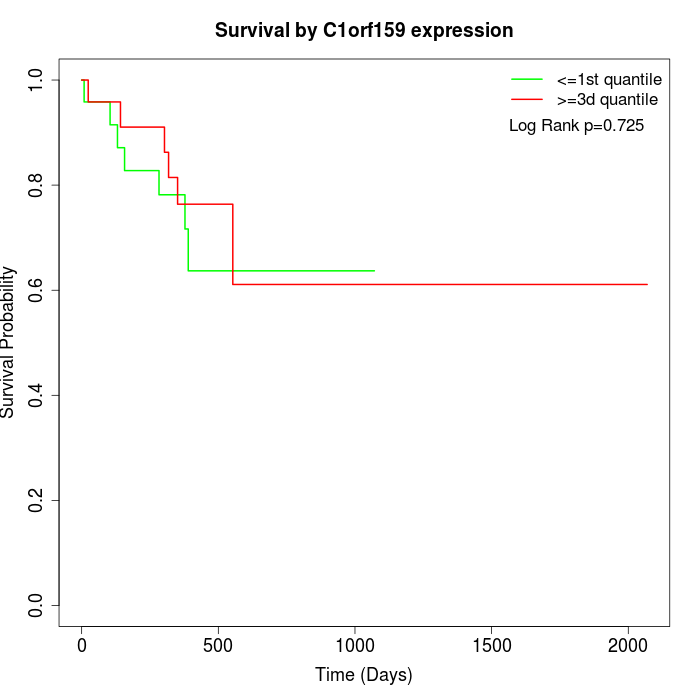 |
| GSE53622 | GSE53624 | TCGA |
Note: Click image to view full size file.
Copy number change of C1orf159:
| Dataset | Gene | EntrezID | Gain | Loss | Normal | Detail |
|---|---|---|---|---|---|---|
| GSE15526 | C1orf159 | 54991 | 3 | 7 | 20 | |
| GSE20123 | C1orf159 | 54991 | 3 | 6 | 21 | |
| GSE43470 | C1orf159 | 54991 | 3 | 5 | 35 | |
| GSE46452 | C1orf159 | 54991 | 7 | 1 | 51 | |
| GSE47630 | C1orf159 | 54991 | 8 | 4 | 28 | |
| GSE54993 | C1orf159 | 54991 | 2 | 2 | 66 | |
| GSE54994 | C1orf159 | 54991 | 15 | 2 | 36 | |
| GSE60625 | C1orf159 | 54991 | 0 | 0 | 11 | |
| GSE74703 | C1orf159 | 54991 | 3 | 3 | 30 | |
| GSE74704 | C1orf159 | 54991 | 3 | 0 | 17 | |
| TCGA | C1orf159 | 54991 | 14 | 20 | 62 |
Total number of gains: 61; Total number of losses: 50; Total Number of normals: 377.
Somatic mutations of C1orf159:
Generating mutation plots.
Highly correlated genes for C1orf159:
Showing top 20/506 corelated genes with mean PCC>0.5.
| Gene1 | Gene2 | Mean PCC | Num. Datasets | Num. PCC<0 | Num. PCC>0.5 |
|---|---|---|---|---|---|
| C1orf159 | ADCK1 | 0.82627 | 3 | 0 | 3 |
| C1orf159 | PCBP3 | 0.773544 | 4 | 0 | 4 |
| C1orf159 | KCNQ2 | 0.756732 | 3 | 0 | 3 |
| C1orf159 | NACC1 | 0.746891 | 4 | 0 | 4 |
| C1orf159 | ZNF467 | 0.744331 | 3 | 0 | 3 |
| C1orf159 | ZNF578 | 0.719864 | 3 | 0 | 3 |
| C1orf159 | COMMD7 | 0.71733 | 3 | 0 | 3 |
| C1orf159 | DCXR | 0.709013 | 3 | 0 | 3 |
| C1orf159 | MTAP | 0.707389 | 3 | 0 | 3 |
| C1orf159 | ZNF707 | 0.707359 | 3 | 0 | 3 |
| C1orf159 | PFKL | 0.704974 | 4 | 0 | 3 |
| C1orf159 | TMEM120A | 0.699317 | 3 | 0 | 3 |
| C1orf159 | PPP1R9B | 0.69653 | 3 | 0 | 3 |
| C1orf159 | MRI1 | 0.696071 | 3 | 0 | 3 |
| C1orf159 | HNF4G | 0.695097 | 3 | 0 | 3 |
| C1orf159 | NAA60 | 0.695048 | 4 | 0 | 4 |
| C1orf159 | SETD4 | 0.692817 | 3 | 0 | 3 |
| C1orf159 | SYN3 | 0.691398 | 3 | 0 | 3 |
| C1orf159 | TAB1 | 0.691079 | 4 | 0 | 3 |
| C1orf159 | SLC25A44 | 0.689956 | 3 | 0 | 3 |
For details and further investigation, click here