| Full name: TGF-beta activated kinase 1 (MAP3K7) binding protein 1 | Alias Symbol: | ||
| Type: protein-coding gene | Cytoband: 22q13.1 | ||
| Entrez ID: 10454 | HGNC ID: HGNC:18157 | Ensembl Gene: ENSG00000100324 | OMIM ID: 602615 |
TAB1 involved pathways:
Expression of TAB1:
| Dataset | Gene | EntrezID | Probe | Log2FC | Adj.pValue | Expression |
|---|---|---|---|---|---|---|
| GSE17351 | TAB1 | 10454 | 203901_at | 0.0007 | 0.9988 | |
| GSE20347 | TAB1 | 10454 | 203901_at | 0.1787 | 0.0361 | |
| GSE23400 | TAB1 | 10454 | 203901_at | -0.0203 | 0.5567 | |
| GSE26886 | TAB1 | 10454 | 203901_at | 0.4443 | 0.0070 | |
| GSE29001 | TAB1 | 10454 | 203901_at | 0.2143 | 0.0901 | |
| GSE38129 | TAB1 | 10454 | 203901_at | 0.0406 | 0.6437 | |
| GSE45670 | TAB1 | 10454 | 203901_at | -0.0366 | 0.7089 | |
| GSE63941 | TAB1 | 10454 | 203901_at | 0.0816 | 0.6809 | |
| GSE77861 | TAB1 | 10454 | 203901_at | -0.1115 | 0.2784 | |
| GSE97050 | TAB1 | 10454 | A_23_P80342 | -0.1316 | 0.6403 | |
| SRP007169 | TAB1 | 10454 | RNAseq | 0.4995 | 0.4367 | |
| SRP008496 | TAB1 | 10454 | RNAseq | 0.6571 | 0.1317 | |
| SRP064894 | TAB1 | 10454 | RNAseq | 0.4625 | 0.0108 | |
| SRP133303 | TAB1 | 10454 | RNAseq | -0.1341 | 0.3257 | |
| SRP159526 | TAB1 | 10454 | RNAseq | -0.1126 | 0.5006 | |
| SRP193095 | TAB1 | 10454 | RNAseq | 0.1154 | 0.2153 | |
| SRP219564 | TAB1 | 10454 | RNAseq | 0.1125 | 0.7530 | |
| TCGA | TAB1 | 10454 | RNAseq | -0.0184 | 0.7184 |
Upregulated datasets: 0; Downregulated datasets: 0.
Survival by TAB1 expression:
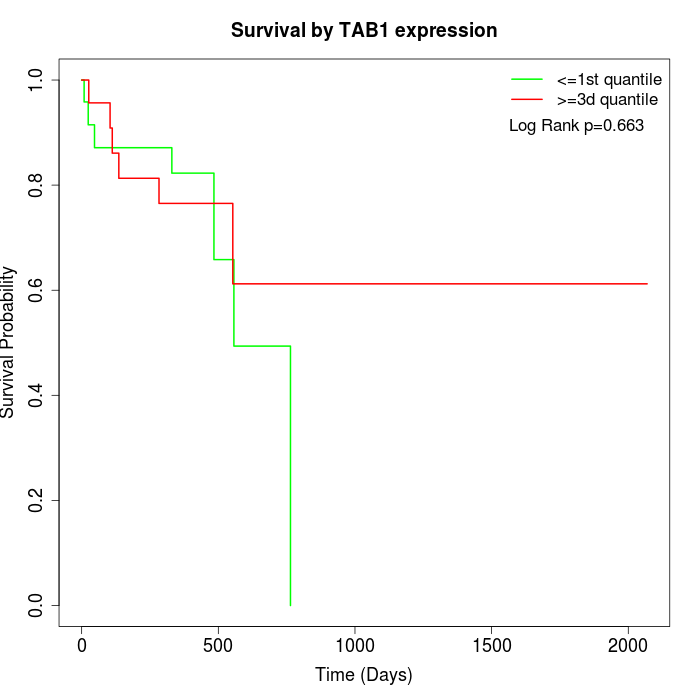 |
| TCGA |
Note: Click image to view full size file.
Copy number change of TAB1:
| Dataset | Gene | EntrezID | Gain | Loss | Normal | Detail |
|---|---|---|---|---|---|---|
| GSE15526 | TAB1 | 10454 | 6 | 5 | 19 | |
| GSE20123 | TAB1 | 10454 | 6 | 4 | 20 | |
| GSE43470 | TAB1 | 10454 | 5 | 6 | 32 | |
| GSE46452 | TAB1 | 10454 | 32 | 2 | 25 | |
| GSE47630 | TAB1 | 10454 | 9 | 4 | 27 | |
| GSE54993 | TAB1 | 10454 | 4 | 5 | 61 | |
| GSE54994 | TAB1 | 10454 | 10 | 7 | 36 | |
| GSE60625 | TAB1 | 10454 | 5 | 0 | 6 | |
| GSE74703 | TAB1 | 10454 | 5 | 4 | 27 | |
| GSE74704 | TAB1 | 10454 | 3 | 2 | 15 | |
| TCGA | TAB1 | 10454 | 27 | 15 | 54 |
Total number of gains: 112; Total number of losses: 54; Total Number of normals: 322.
Somatic mutations of TAB1:
Generating mutation plots.
Highly correlated genes for TAB1:
Showing top 20/320 corelated genes with mean PCC>0.5.
| Gene1 | Gene2 | Mean PCC | Num. Datasets | Num. PCC<0 | Num. PCC>0.5 |
|---|---|---|---|---|---|
| TAB1 | ZNF467 | 0.796332 | 3 | 0 | 3 |
| TAB1 | CCND3 | 0.79516 | 3 | 0 | 3 |
| TAB1 | PLCL1 | 0.771308 | 3 | 0 | 3 |
| TAB1 | TMEM140 | 0.763492 | 3 | 0 | 3 |
| TAB1 | PSMC3IP | 0.762816 | 3 | 0 | 3 |
| TAB1 | GNG7 | 0.760629 | 3 | 0 | 3 |
| TAB1 | FOXP4 | 0.758715 | 3 | 0 | 3 |
| TAB1 | SH2B1 | 0.758647 | 3 | 0 | 3 |
| TAB1 | KIAA0513 | 0.758031 | 3 | 0 | 3 |
| TAB1 | ZBTB10 | 0.751665 | 3 | 0 | 3 |
| TAB1 | TMEM170B | 0.747773 | 3 | 0 | 3 |
| TAB1 | FRZB | 0.747658 | 3 | 0 | 3 |
| TAB1 | GBA2 | 0.743429 | 3 | 0 | 3 |
| TAB1 | KCND3 | 0.742688 | 3 | 0 | 3 |
| TAB1 | MMP15 | 0.742683 | 3 | 0 | 3 |
| TAB1 | MAP1S | 0.734301 | 4 | 0 | 4 |
| TAB1 | ROMO1 | 0.733546 | 3 | 0 | 3 |
| TAB1 | CAMTA1 | 0.725237 | 4 | 0 | 3 |
| TAB1 | HIGD2A | 0.716714 | 4 | 0 | 3 |
| TAB1 | ZNF419 | 0.714777 | 3 | 0 | 3 |
For details and further investigation, click here