| Full name: methylthioribose-1-phosphate isomerase 1 | Alias Symbol: MGC3207|Ypr118w|mtnA|MRDI | ||
| Type: protein-coding gene | Cytoband: 19p13.13 | ||
| Entrez ID: 84245 | HGNC ID: HGNC:28469 | Ensembl Gene: ENSG00000037757 | OMIM ID: 615105 |
Expression of MRI1:
| Dataset | Gene | EntrezID | Probe | Log2FC | Adj.pValue | Expression |
|---|---|---|---|---|---|---|
| GSE17351 | MRI1 | 84245 | 228077_at | 0.1221 | 0.8855 | |
| GSE26886 | MRI1 | 84245 | 228077_at | 0.4494 | 0.1033 | |
| GSE45670 | MRI1 | 84245 | 228077_at | -0.1394 | 0.4716 | |
| GSE63941 | MRI1 | 84245 | 228077_at | 0.2096 | 0.7518 | |
| GSE77861 | MRI1 | 84245 | 228077_at | 0.1163 | 0.7303 | |
| GSE97050 | MRI1 | 84245 | A_24_P279797 | -0.2062 | 0.4229 | |
| SRP007169 | MRI1 | 84245 | RNAseq | -0.5556 | 0.2950 | |
| SRP008496 | MRI1 | 84245 | RNAseq | -0.3387 | 0.2955 | |
| SRP064894 | MRI1 | 84245 | RNAseq | 0.1666 | 0.3857 | |
| SRP133303 | MRI1 | 84245 | RNAseq | -0.1043 | 0.5184 | |
| SRP159526 | MRI1 | 84245 | RNAseq | -0.1875 | 0.5398 | |
| SRP193095 | MRI1 | 84245 | RNAseq | 0.0313 | 0.8094 | |
| SRP219564 | MRI1 | 84245 | RNAseq | 0.2270 | 0.6069 | |
| TCGA | MRI1 | 84245 | RNAseq | 0.0752 | 0.2880 |
Upregulated datasets: 0; Downregulated datasets: 0.
Survival by MRI1 expression:
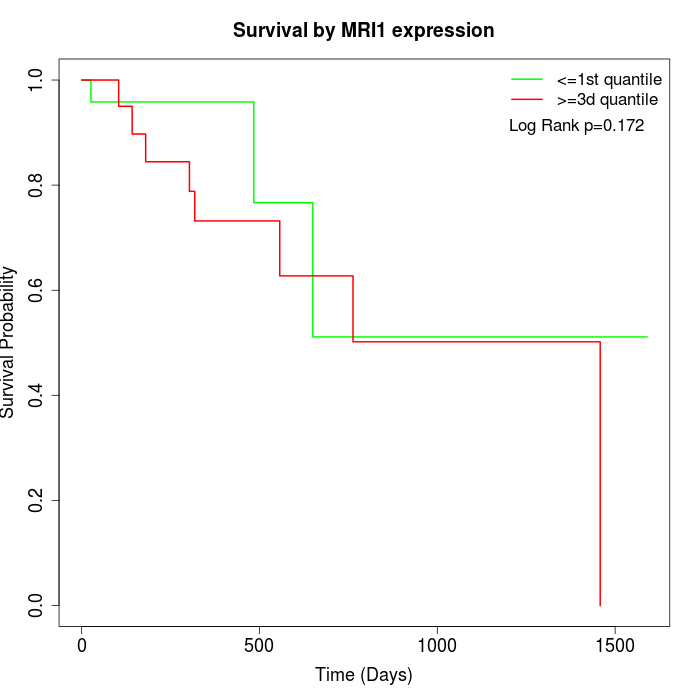 |
| TCGA |
Note: Click image to view full size file.
Copy number change of MRI1:
| Dataset | Gene | EntrezID | Gain | Loss | Normal | Detail |
|---|---|---|---|---|---|---|
| GSE15526 | MRI1 | 84245 | 4 | 2 | 24 | |
| GSE20123 | MRI1 | 84245 | 3 | 1 | 26 | |
| GSE43470 | MRI1 | 84245 | 2 | 6 | 35 | |
| GSE46452 | MRI1 | 84245 | 47 | 1 | 11 | |
| GSE47630 | MRI1 | 84245 | 4 | 7 | 29 | |
| GSE54993 | MRI1 | 84245 | 15 | 4 | 51 | |
| GSE54994 | MRI1 | 84245 | 6 | 13 | 34 | |
| GSE60625 | MRI1 | 84245 | 9 | 0 | 2 | |
| GSE74703 | MRI1 | 84245 | 2 | 4 | 30 | |
| GSE74704 | MRI1 | 84245 | 0 | 1 | 19 | |
| TCGA | MRI1 | 84245 | 21 | 11 | 64 |
Total number of gains: 113; Total number of losses: 50; Total Number of normals: 325.
Somatic mutations of MRI1:
Generating mutation plots.
Highly correlated genes for MRI1:
Showing top 20/178 corelated genes with mean PCC>0.5.
| Gene1 | Gene2 | Mean PCC | Num. Datasets | Num. PCC<0 | Num. PCC>0.5 |
|---|---|---|---|---|---|
| MRI1 | MRPL18 | 0.816999 | 3 | 0 | 3 |
| MRI1 | PPARG | 0.799004 | 3 | 0 | 3 |
| MRI1 | SNRPD3 | 0.795355 | 3 | 0 | 3 |
| MRI1 | FBXW9 | 0.792592 | 3 | 0 | 3 |
| MRI1 | MLLT1 | 0.783 | 3 | 0 | 3 |
| MRI1 | ZBTB44 | 0.775805 | 3 | 0 | 3 |
| MRI1 | DHX40 | 0.752099 | 3 | 0 | 3 |
| MRI1 | FBL | 0.749743 | 3 | 0 | 3 |
| MRI1 | ALG6 | 0.747382 | 3 | 0 | 3 |
| MRI1 | REPS1 | 0.743928 | 3 | 0 | 3 |
| MRI1 | TXNL4A | 0.742773 | 3 | 0 | 3 |
| MRI1 | ETV6 | 0.740988 | 3 | 0 | 3 |
| MRI1 | YIPF2 | 0.737902 | 3 | 0 | 3 |
| MRI1 | MEPCE | 0.737107 | 3 | 0 | 3 |
| MRI1 | CHD4 | 0.734352 | 3 | 0 | 3 |
| MRI1 | THADA | 0.730878 | 3 | 0 | 3 |
| MRI1 | STX10 | 0.730417 | 4 | 0 | 3 |
| MRI1 | QTRT1 | 0.728427 | 4 | 0 | 4 |
| MRI1 | DNAJC11 | 0.727701 | 3 | 0 | 3 |
| MRI1 | ING4 | 0.724474 | 3 | 0 | 3 |
For details and further investigation, click here