| Full name: carbonic anhydrase 10 | Alias Symbol: CARPX|CA-RPX|HUCEP-15 | ||
| Type: protein-coding gene | Cytoband: 17q21.33-q22 | ||
| Entrez ID: 56934 | HGNC ID: HGNC:1369 | Ensembl Gene: ENSG00000154975 | OMIM ID: 604642 |
Expression of CA10:
| Dataset | Gene | EntrezID | Probe | Log2FC | Adj.pValue | Expression |
|---|---|---|---|---|---|---|
| GSE17351 | CA10 | 56934 | 223550_s_at | -0.1028 | 0.6987 | |
| GSE20347 | CA10 | 56934 | 220889_s_at | 0.0284 | 0.5915 | |
| GSE23400 | CA10 | 56934 | 220889_s_at | -0.0068 | 0.7497 | |
| GSE26886 | CA10 | 56934 | 223550_s_at | 0.0243 | 0.8950 | |
| GSE29001 | CA10 | 56934 | 220889_s_at | 0.0242 | 0.8706 | |
| GSE38129 | CA10 | 56934 | 220889_s_at | -0.0054 | 0.9353 | |
| GSE45670 | CA10 | 56934 | 223550_s_at | -0.0313 | 0.7746 | |
| GSE53622 | CA10 | 56934 | 92160 | -0.4981 | 0.0034 | |
| GSE53624 | CA10 | 56934 | 92160 | -1.2011 | 0.0000 | |
| GSE63941 | CA10 | 56934 | 223550_s_at | 0.1209 | 0.3900 | |
| GSE77861 | CA10 | 56934 | 223550_s_at | -0.0945 | 0.3648 | |
| TCGA | CA10 | 56934 | RNAseq | -0.3021 | 0.8065 |
Upregulated datasets: 0; Downregulated datasets: 1.
Survival by CA10 expression:
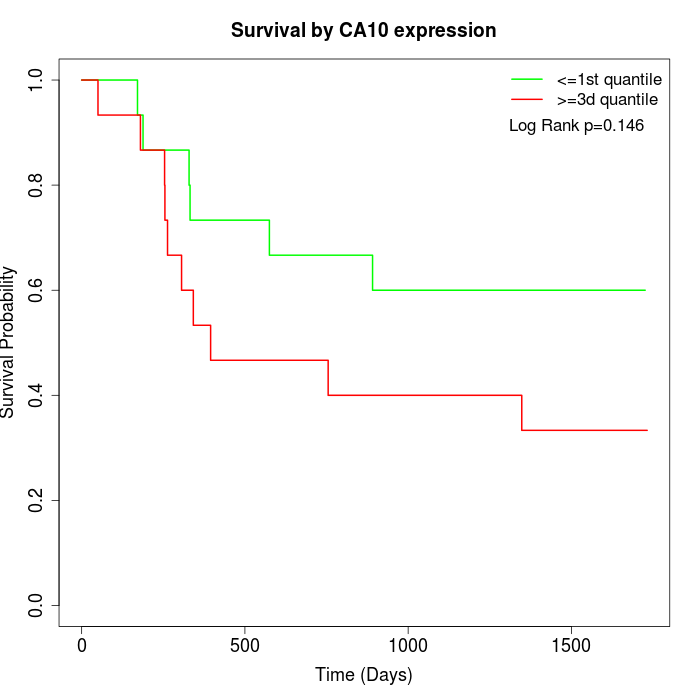 | 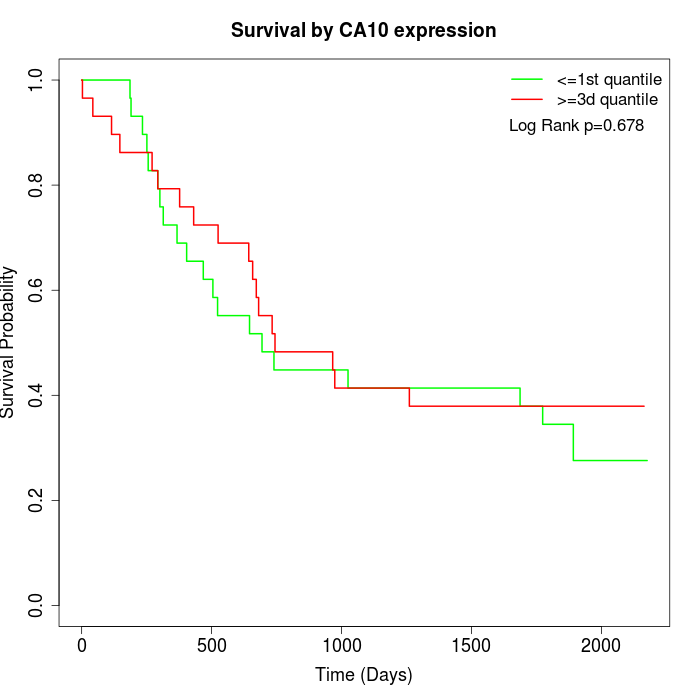 | 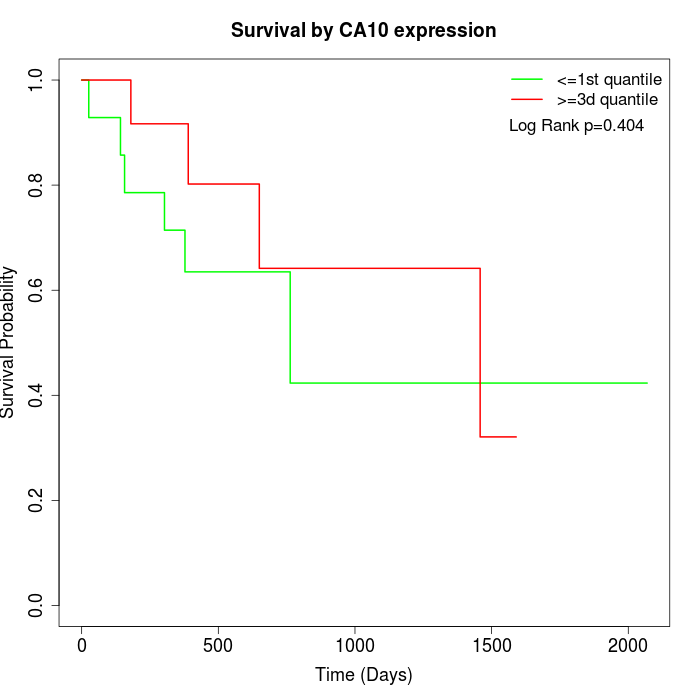 |
| GSE53622 | GSE53624 | TCGA |
Note: Click image to view full size file.
Copy number change of CA10:
| Dataset | Gene | EntrezID | Gain | Loss | Normal | Detail |
|---|---|---|---|---|---|---|
| GSE15526 | CA10 | 56934 | 4 | 1 | 25 | |
| GSE20123 | CA10 | 56934 | 4 | 1 | 25 | |
| GSE43470 | CA10 | 56934 | 2 | 2 | 39 | |
| GSE46452 | CA10 | 56934 | 32 | 0 | 27 | |
| GSE47630 | CA10 | 56934 | 9 | 0 | 31 | |
| GSE54993 | CA10 | 56934 | 2 | 4 | 64 | |
| GSE54994 | CA10 | 56934 | 8 | 6 | 39 | |
| GSE60625 | CA10 | 56934 | 4 | 0 | 7 | |
| GSE74703 | CA10 | 56934 | 2 | 2 | 32 | |
| GSE74704 | CA10 | 56934 | 3 | 1 | 16 | |
| TCGA | CA10 | 56934 | 26 | 8 | 62 |
Total number of gains: 96; Total number of losses: 25; Total Number of normals: 367.
Somatic mutations of CA10:
Generating mutation plots.
Highly correlated genes for CA10:
Showing top 20/146 corelated genes with mean PCC>0.5.
| Gene1 | Gene2 | Mean PCC | Num. Datasets | Num. PCC<0 | Num. PCC>0.5 |
|---|---|---|---|---|---|
| CA10 | ACTN2 | 0.651073 | 3 | 0 | 3 |
| CA10 | HMX2 | 0.647242 | 3 | 0 | 3 |
| CA10 | CELA2B | 0.630422 | 3 | 0 | 3 |
| CA10 | MYOD1 | 0.619066 | 4 | 0 | 3 |
| CA10 | INSL5 | 0.615084 | 4 | 0 | 4 |
| CA10 | SLC10A2 | 0.613459 | 3 | 0 | 3 |
| CA10 | NMBR | 0.611429 | 4 | 0 | 3 |
| CA10 | NEUROD2 | 0.608287 | 4 | 0 | 4 |
| CA10 | FGF20 | 0.600866 | 3 | 0 | 3 |
| CA10 | RASGRF1 | 0.599853 | 5 | 0 | 4 |
| CA10 | MAP3K19 | 0.59934 | 3 | 0 | 3 |
| CA10 | NTNG1 | 0.593502 | 4 | 0 | 3 |
| CA10 | BRINP2 | 0.592639 | 4 | 0 | 3 |
| CA10 | ROS1 | 0.592311 | 3 | 0 | 3 |
| CA10 | HTR1F | 0.591761 | 4 | 0 | 3 |
| CA10 | ZNF460 | 0.587342 | 4 | 0 | 3 |
| CA10 | CDHR2 | 0.586657 | 4 | 0 | 3 |
| CA10 | MC2R | 0.585368 | 4 | 0 | 3 |
| CA10 | MAPK4 | 0.585029 | 3 | 0 | 3 |
| CA10 | FCGR1A | 0.582249 | 5 | 0 | 3 |
For details and further investigation, click here