| Full name: Cdk5 and Abl enzyme substrate 1 | Alias Symbol: HsT2563|FLJ35924 | ||
| Type: protein-coding gene | Cytoband: 18q11.2 | ||
| Entrez ID: 91768 | HGNC ID: HGNC:25097 | Ensembl Gene: ENSG00000134508 | OMIM ID: 609194 |
Expression of CABLES1:
| Dataset | Gene | EntrezID | Probe | Log2FC | Adj.pValue | Expression |
|---|---|---|---|---|---|---|
| GSE17351 | CABLES1 | 91768 | 225532_at | -0.2239 | 0.5948 | |
| GSE26886 | CABLES1 | 91768 | 225532_at | -0.5687 | 0.0267 | |
| GSE45670 | CABLES1 | 91768 | 225532_at | -0.5985 | 0.0009 | |
| GSE53622 | CABLES1 | 91768 | 68717 | -0.7317 | 0.0000 | |
| GSE53624 | CABLES1 | 91768 | 68717 | -1.1554 | 0.0000 | |
| GSE63941 | CABLES1 | 91768 | 225532_at | -3.5615 | 0.0004 | |
| GSE77861 | CABLES1 | 91768 | 225532_at | -0.4588 | 0.0114 | |
| GSE97050 | CABLES1 | 91768 | A_23_P422851 | 0.1440 | 0.5423 | |
| SRP007169 | CABLES1 | 91768 | RNAseq | -1.5766 | 0.0329 | |
| SRP064894 | CABLES1 | 91768 | RNAseq | -1.3606 | 0.0000 | |
| SRP133303 | CABLES1 | 91768 | RNAseq | -0.8119 | 0.0000 | |
| SRP159526 | CABLES1 | 91768 | RNAseq | 0.1051 | 0.8189 | |
| SRP193095 | CABLES1 | 91768 | RNAseq | -0.6646 | 0.0107 | |
| SRP219564 | CABLES1 | 91768 | RNAseq | -0.6099 | 0.3281 | |
| TCGA | CABLES1 | 91768 | RNAseq | -0.5146 | 0.0001 |
Upregulated datasets: 0; Downregulated datasets: 4.
Survival by CABLES1 expression:
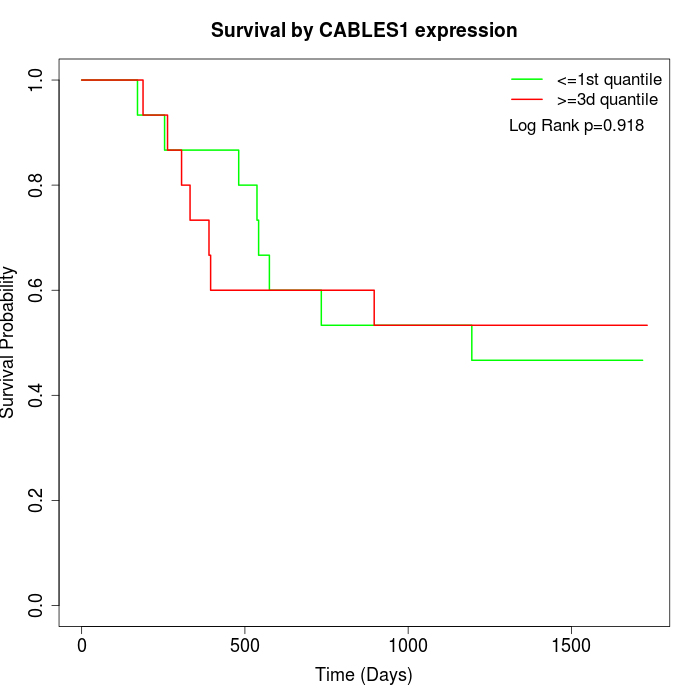 | 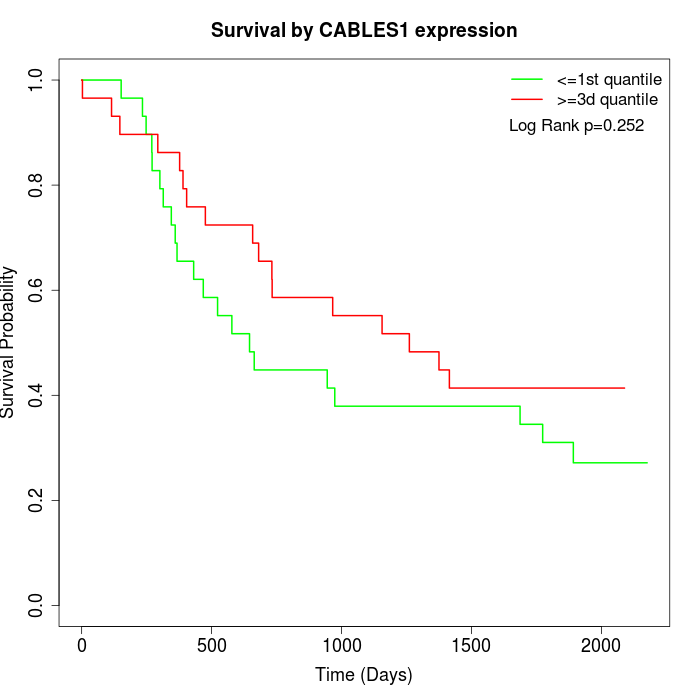 | 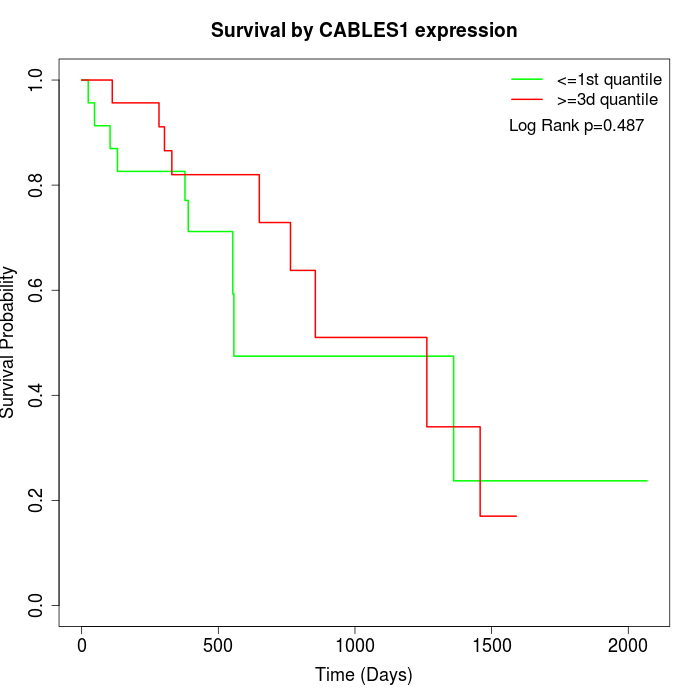 |
| GSE53622 | GSE53624 | TCGA |
Note: Click image to view full size file.
Copy number change of CABLES1:
| Dataset | Gene | EntrezID | Gain | Loss | Normal | Detail |
|---|---|---|---|---|---|---|
| GSE15526 | CABLES1 | 91768 | 2 | 6 | 22 | |
| GSE20123 | CABLES1 | 91768 | 1 | 6 | 23 | |
| GSE43470 | CABLES1 | 91768 | 2 | 1 | 40 | |
| GSE46452 | CABLES1 | 91768 | 3 | 23 | 33 | |
| GSE47630 | CABLES1 | 91768 | 7 | 17 | 16 | |
| GSE54993 | CABLES1 | 91768 | 7 | 1 | 62 | |
| GSE54994 | CABLES1 | 91768 | 4 | 12 | 37 | |
| GSE60625 | CABLES1 | 91768 | 0 | 4 | 7 | |
| GSE74703 | CABLES1 | 91768 | 2 | 1 | 33 | |
| GSE74704 | CABLES1 | 91768 | 1 | 5 | 14 | |
| TCGA | CABLES1 | 91768 | 15 | 24 | 57 |
Total number of gains: 44; Total number of losses: 100; Total Number of normals: 344.
Somatic mutations of CABLES1:
Generating mutation plots.
Highly correlated genes for CABLES1:
Showing top 20/644 corelated genes with mean PCC>0.5.
| Gene1 | Gene2 | Mean PCC | Num. Datasets | Num. PCC<0 | Num. PCC>0.5 |
|---|---|---|---|---|---|
| CABLES1 | PAPSS2 | 0.789607 | 3 | 0 | 3 |
| CABLES1 | C1GALT1C1 | 0.753063 | 3 | 0 | 3 |
| CABLES1 | PRR16 | 0.746334 | 3 | 0 | 3 |
| CABLES1 | SLAMF7 | 0.741683 | 3 | 0 | 3 |
| CABLES1 | KRTAP5-8 | 0.729214 | 3 | 0 | 3 |
| CABLES1 | GNG5 | 0.716997 | 3 | 0 | 3 |
| CABLES1 | TK2 | 0.716515 | 3 | 0 | 3 |
| CABLES1 | SPCS3 | 0.706434 | 3 | 0 | 3 |
| CABLES1 | APBB1IP | 0.703237 | 3 | 0 | 3 |
| CABLES1 | ZFY | 0.697483 | 3 | 0 | 3 |
| CABLES1 | CCR2 | 0.695482 | 3 | 0 | 3 |
| CABLES1 | FAM155A | 0.695023 | 4 | 0 | 3 |
| CABLES1 | TXNDC17 | 0.682742 | 3 | 0 | 3 |
| CABLES1 | SPATA31E1 | 0.679367 | 3 | 0 | 3 |
| CABLES1 | SNCG | 0.6775 | 3 | 0 | 3 |
| CABLES1 | GLT8D1 | 0.673474 | 4 | 0 | 3 |
| CABLES1 | SLC35F5 | 0.668097 | 3 | 0 | 3 |
| CABLES1 | RINT1 | 0.667515 | 3 | 0 | 3 |
| CABLES1 | MED8 | 0.664601 | 3 | 0 | 3 |
| CABLES1 | ANGPTL4 | 0.662402 | 3 | 0 | 3 |
For details and further investigation, click here