| Full name: glycosyltransferase 8 domain containing 1 | Alias Symbol: AD-017|FLJ14611 | ||
| Type: protein-coding gene | Cytoband: 3p21.1 | ||
| Entrez ID: 55830 | HGNC ID: HGNC:24870 | Ensembl Gene: ENSG00000016864 | OMIM ID: 618399 |
Expression of GLT8D1:
| Dataset | Gene | EntrezID | Probe | Log2FC | Adj.pValue | Expression |
|---|---|---|---|---|---|---|
| GSE17351 | GLT8D1 | 55830 | 218146_at | -0.0348 | 0.9159 | |
| GSE20347 | GLT8D1 | 55830 | 218146_at | 0.0234 | 0.8400 | |
| GSE23400 | GLT8D1 | 55830 | 218146_at | 0.1744 | 0.0005 | |
| GSE26886 | GLT8D1 | 55830 | 218146_at | 0.7280 | 0.0001 | |
| GSE29001 | GLT8D1 | 55830 | 218146_at | -0.0334 | 0.9110 | |
| GSE38129 | GLT8D1 | 55830 | 218146_at | 0.0134 | 0.8706 | |
| GSE45670 | GLT8D1 | 55830 | 218146_at | -0.0701 | 0.5956 | |
| GSE53622 | GLT8D1 | 55830 | 19023 | 0.4708 | 0.0000 | |
| GSE53624 | GLT8D1 | 55830 | 19023 | 0.2495 | 0.0002 | |
| GSE63941 | GLT8D1 | 55830 | 218146_at | -1.1076 | 0.0005 | |
| GSE77861 | GLT8D1 | 55830 | 218146_at | -0.0533 | 0.7616 | |
| GSE97050 | GLT8D1 | 55830 | A_33_P3275290 | 0.3124 | 0.1782 | |
| SRP007169 | GLT8D1 | 55830 | RNAseq | 0.6152 | 0.1987 | |
| SRP008496 | GLT8D1 | 55830 | RNAseq | 0.8882 | 0.0013 | |
| SRP064894 | GLT8D1 | 55830 | RNAseq | 0.4800 | 0.0069 | |
| SRP133303 | GLT8D1 | 55830 | RNAseq | 0.2111 | 0.0761 | |
| SRP159526 | GLT8D1 | 55830 | RNAseq | 0.2707 | 0.1081 | |
| SRP193095 | GLT8D1 | 55830 | RNAseq | -0.1720 | 0.1397 | |
| SRP219564 | GLT8D1 | 55830 | RNAseq | 0.2123 | 0.5009 | |
| TCGA | GLT8D1 | 55830 | RNAseq | -0.0749 | 0.1507 |
Upregulated datasets: 0; Downregulated datasets: 1.
Survival by GLT8D1 expression:
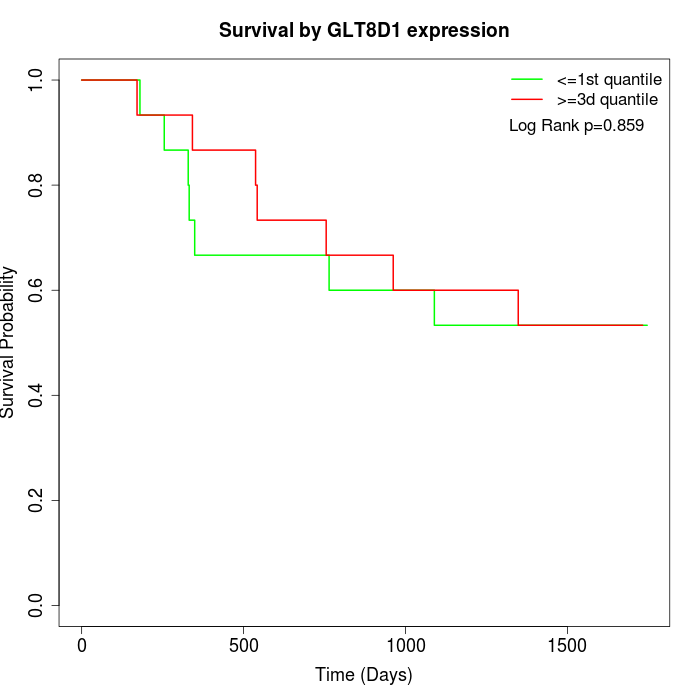 | 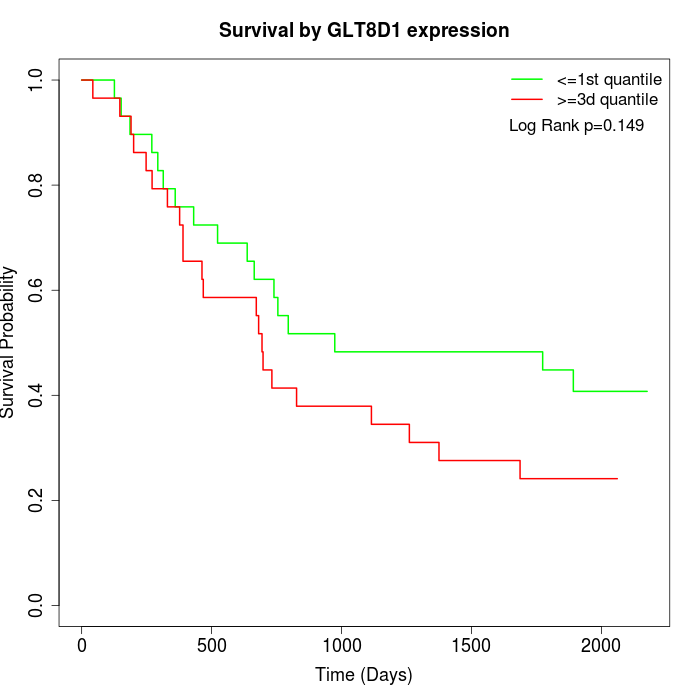 | 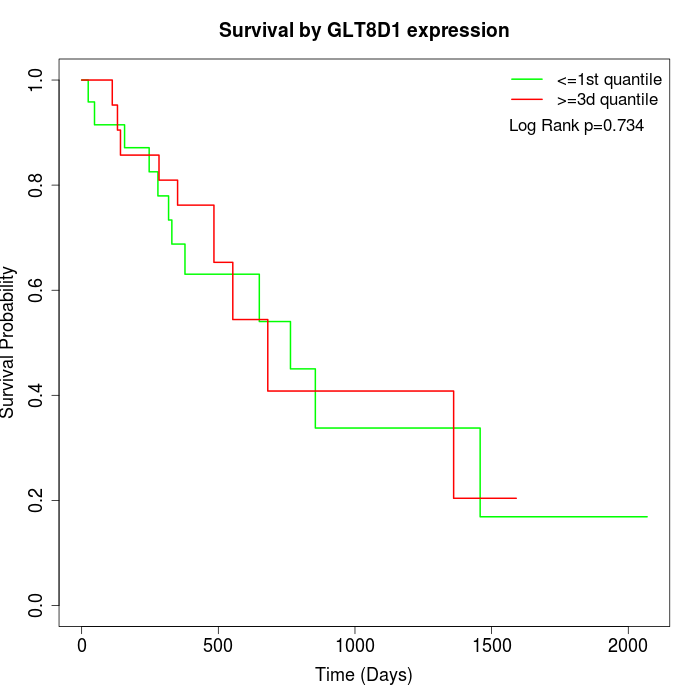 |
| GSE53622 | GSE53624 | TCGA |
Note: Click image to view full size file.
Copy number change of GLT8D1:
| Dataset | Gene | EntrezID | Gain | Loss | Normal | Detail |
|---|---|---|---|---|---|---|
| GSE15526 | GLT8D1 | 55830 | 0 | 18 | 12 | |
| GSE20123 | GLT8D1 | 55830 | 0 | 19 | 11 | |
| GSE43470 | GLT8D1 | 55830 | 0 | 18 | 25 | |
| GSE46452 | GLT8D1 | 55830 | 2 | 17 | 40 | |
| GSE47630 | GLT8D1 | 55830 | 1 | 24 | 15 | |
| GSE54993 | GLT8D1 | 55830 | 6 | 2 | 62 | |
| GSE54994 | GLT8D1 | 55830 | 0 | 33 | 20 | |
| GSE60625 | GLT8D1 | 55830 | 5 | 0 | 6 | |
| GSE74703 | GLT8D1 | 55830 | 0 | 14 | 22 | |
| GSE74704 | GLT8D1 | 55830 | 0 | 12 | 8 | |
| TCGA | GLT8D1 | 55830 | 0 | 78 | 18 |
Total number of gains: 14; Total number of losses: 235; Total Number of normals: 239.
Somatic mutations of GLT8D1:
Generating mutation plots.
Highly correlated genes for GLT8D1:
Showing top 20/701 corelated genes with mean PCC>0.5.
| Gene1 | Gene2 | Mean PCC | Num. Datasets | Num. PCC<0 | Num. PCC>0.5 |
|---|---|---|---|---|---|
| GLT8D1 | HEATR6 | 0.808013 | 3 | 0 | 3 |
| GLT8D1 | BUD31 | 0.780878 | 3 | 0 | 3 |
| GLT8D1 | FAF2 | 0.750979 | 3 | 0 | 3 |
| GLT8D1 | RBBP6 | 0.744554 | 3 | 0 | 3 |
| GLT8D1 | PLAU | 0.73947 | 3 | 0 | 3 |
| GLT8D1 | ERCC2 | 0.738042 | 3 | 0 | 3 |
| GLT8D1 | NKAP | 0.729906 | 3 | 0 | 3 |
| GLT8D1 | THEM4 | 0.727573 | 3 | 0 | 3 |
| GLT8D1 | PSMB4 | 0.726488 | 3 | 0 | 3 |
| GLT8D1 | DNASE2 | 0.722336 | 3 | 0 | 3 |
| GLT8D1 | ABHD16B | 0.721475 | 3 | 0 | 3 |
| GLT8D1 | TMEM184C | 0.712757 | 3 | 0 | 3 |
| GLT8D1 | DROSHA | 0.711663 | 3 | 0 | 3 |
| GLT8D1 | SPI1 | 0.710532 | 3 | 0 | 3 |
| GLT8D1 | DNTTIP1 | 0.707534 | 4 | 0 | 3 |
| GLT8D1 | NF1 | 0.707041 | 3 | 0 | 3 |
| GLT8D1 | PTPN12 | 0.705681 | 3 | 0 | 3 |
| GLT8D1 | WDR86 | 0.705601 | 4 | 0 | 4 |
| GLT8D1 | GNGT2 | 0.704594 | 3 | 0 | 3 |
| GLT8D1 | TRAPPC2L | 0.704379 | 3 | 0 | 3 |
For details and further investigation, click here