| Full name: CTD small phosphatase 1 | Alias Symbol: NLIIF|SCP1 | ||
| Type: protein-coding gene | Cytoband: 2q35 | ||
| Entrez ID: 58190 | HGNC ID: HGNC:21614 | Ensembl Gene: ENSG00000144579 | OMIM ID: 605323 |
Expression of CTDSP1:
| Dataset | Gene | EntrezID | Probe | Log2FC | Adj.pValue | Expression |
|---|---|---|---|---|---|---|
| GSE17351 | CTDSP1 | 58190 | 217844_at | -0.1498 | 0.6813 | |
| GSE20347 | CTDSP1 | 58190 | 217844_at | -0.3009 | 0.0169 | |
| GSE23400 | CTDSP1 | 58190 | 217844_at | -0.1598 | 0.0043 | |
| GSE26886 | CTDSP1 | 58190 | 217844_at | 0.2741 | 0.0547 | |
| GSE29001 | CTDSP1 | 58190 | 217844_at | -0.2097 | 0.3254 | |
| GSE38129 | CTDSP1 | 58190 | 217844_at | -0.4603 | 0.0003 | |
| GSE45670 | CTDSP1 | 58190 | 217844_at | -0.2611 | 0.0317 | |
| GSE53622 | CTDSP1 | 58190 | 44584 | -0.1446 | 0.0307 | |
| GSE53624 | CTDSP1 | 58190 | 157400 | -0.3453 | 0.0000 | |
| GSE63941 | CTDSP1 | 58190 | 217844_at | -0.5610 | 0.0279 | |
| GSE77861 | CTDSP1 | 58190 | 217844_at | 0.0637 | 0.8130 | |
| GSE97050 | CTDSP1 | 58190 | A_24_P97197 | -0.1097 | 0.6571 | |
| SRP007169 | CTDSP1 | 58190 | RNAseq | -0.5720 | 0.1650 | |
| SRP008496 | CTDSP1 | 58190 | RNAseq | -0.4552 | 0.0614 | |
| SRP064894 | CTDSP1 | 58190 | RNAseq | 0.0734 | 0.7522 | |
| SRP133303 | CTDSP1 | 58190 | RNAseq | -0.3039 | 0.0009 | |
| SRP159526 | CTDSP1 | 58190 | RNAseq | -0.2880 | 0.1322 | |
| SRP193095 | CTDSP1 | 58190 | RNAseq | -0.3952 | 0.0002 | |
| SRP219564 | CTDSP1 | 58190 | RNAseq | -0.4153 | 0.2759 | |
| TCGA | CTDSP1 | 58190 | RNAseq | -0.1893 | 0.0000 |
Upregulated datasets: 0; Downregulated datasets: 0.
Survival by CTDSP1 expression:
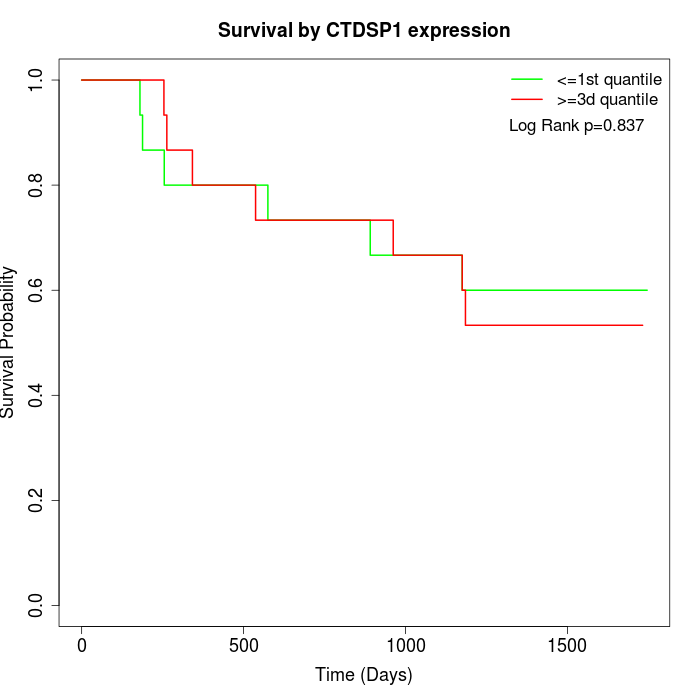 | 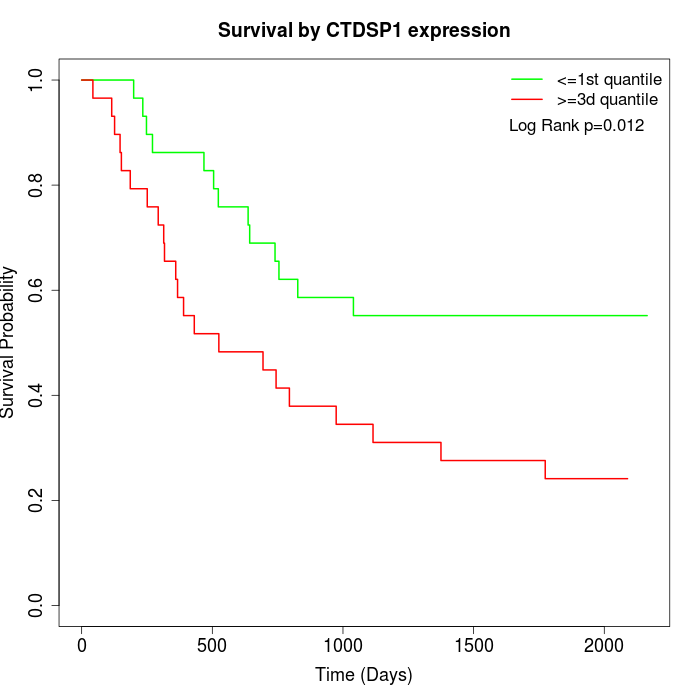 | 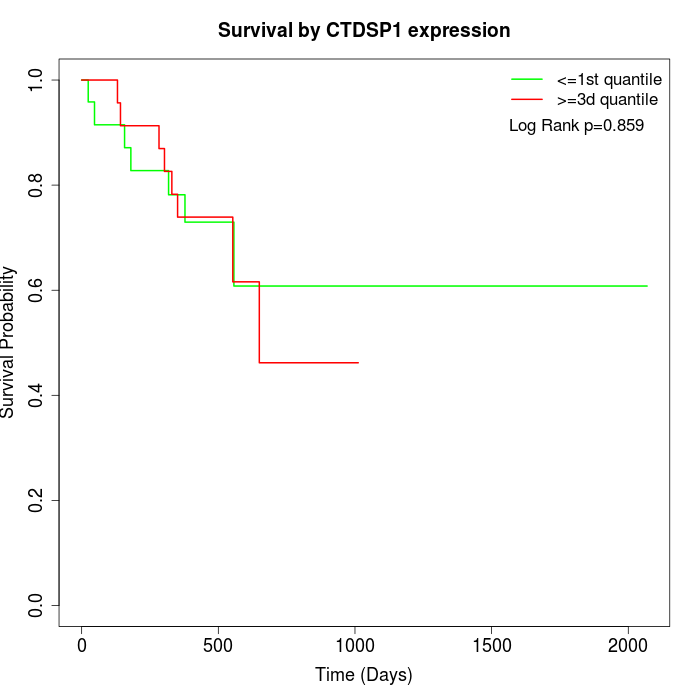 |
| GSE53622 | GSE53624 | TCGA |
Note: Click image to view full size file.
Copy number change of CTDSP1:
| Dataset | Gene | EntrezID | Gain | Loss | Normal | Detail |
|---|---|---|---|---|---|---|
| GSE15526 | CTDSP1 | 58190 | 1 | 14 | 15 | |
| GSE20123 | CTDSP1 | 58190 | 1 | 13 | 16 | |
| GSE43470 | CTDSP1 | 58190 | 1 | 7 | 35 | |
| GSE46452 | CTDSP1 | 58190 | 0 | 5 | 54 | |
| GSE47630 | CTDSP1 | 58190 | 4 | 5 | 31 | |
| GSE54993 | CTDSP1 | 58190 | 1 | 2 | 67 | |
| GSE54994 | CTDSP1 | 58190 | 8 | 10 | 35 | |
| GSE60625 | CTDSP1 | 58190 | 0 | 3 | 8 | |
| GSE74703 | CTDSP1 | 58190 | 1 | 5 | 30 | |
| GSE74704 | CTDSP1 | 58190 | 1 | 7 | 12 | |
| TCGA | CTDSP1 | 58190 | 11 | 29 | 56 |
Total number of gains: 29; Total number of losses: 100; Total Number of normals: 359.
Somatic mutations of CTDSP1:
Generating mutation plots.
Highly correlated genes for CTDSP1:
Showing top 20/477 corelated genes with mean PCC>0.5.
| Gene1 | Gene2 | Mean PCC | Num. Datasets | Num. PCC<0 | Num. PCC>0.5 |
|---|---|---|---|---|---|
| CTDSP1 | ZNF408 | 0.789984 | 4 | 0 | 4 |
| CTDSP1 | ZNF771 | 0.786675 | 3 | 0 | 3 |
| CTDSP1 | AAAS | 0.765094 | 5 | 0 | 4 |
| CTDSP1 | TRIM47 | 0.751924 | 3 | 0 | 3 |
| CTDSP1 | MAPK10 | 0.741352 | 3 | 0 | 3 |
| CTDSP1 | BIRC6 | 0.734579 | 3 | 0 | 3 |
| CTDSP1 | BSN | 0.73043 | 3 | 0 | 3 |
| CTDSP1 | PWWP2A | 0.728833 | 3 | 0 | 3 |
| CTDSP1 | LIMD2 | 0.726742 | 3 | 0 | 3 |
| CTDSP1 | PLXNA2 | 0.72642 | 3 | 0 | 3 |
| CTDSP1 | EXTL1 | 0.724751 | 3 | 0 | 3 |
| CTDSP1 | DNAJB12 | 0.723075 | 5 | 0 | 5 |
| CTDSP1 | SAFB2 | 0.720266 | 3 | 0 | 3 |
| CTDSP1 | FN3K | 0.716769 | 3 | 0 | 3 |
| CTDSP1 | KLF4 | 0.716013 | 3 | 0 | 3 |
| CTDSP1 | RNF207 | 0.715091 | 4 | 0 | 3 |
| CTDSP1 | SUGP1 | 0.712895 | 4 | 0 | 4 |
| CTDSP1 | COPS7A | 0.70702 | 3 | 0 | 3 |
| CTDSP1 | HHLA1 | 0.70408 | 3 | 0 | 3 |
| CTDSP1 | ZNF564 | 0.701601 | 3 | 0 | 3 |
For details and further investigation, click here