| Full name: cortactin | Alias Symbol: | ||
| Type: protein-coding gene | Cytoband: 11q13.3 | ||
| Entrez ID: 2017 | HGNC ID: HGNC:3338 | Ensembl Gene: ENSG00000085733 | OMIM ID: 164765 |
CTTN involved pathways:
| KEGG pathway | Description | View |
|---|---|---|
| hsa04530 | Tight junction | |
| hsa05100 | Bacterial invasion of epithelial cells | |
| hsa05205 | Proteoglycans in cancer |
Expression of CTTN:
| Dataset | Gene | EntrezID | Probe | Log2FC | Adj.pValue | Expression |
|---|---|---|---|---|---|---|
| GSE17351 | CTTN | 2017 | 201059_at | 0.7889 | 0.3826 | |
| GSE20347 | CTTN | 2017 | 201059_at | 0.4671 | 0.1505 | |
| GSE23400 | CTTN | 2017 | 201059_at | 0.2406 | 0.1232 | |
| GSE26886 | CTTN | 2017 | 201059_at | 0.0593 | 0.8621 | |
| GSE29001 | CTTN | 2017 | 201059_at | 0.0263 | 0.9484 | |
| GSE38129 | CTTN | 2017 | 201059_at | 0.6760 | 0.0107 | |
| GSE45670 | CTTN | 2017 | 201059_at | 0.2422 | 0.4276 | |
| GSE53622 | CTTN | 2017 | 98024 | 0.5384 | 0.0001 | |
| GSE53624 | CTTN | 2017 | 98024 | 0.5078 | 0.0000 | |
| GSE63941 | CTTN | 2017 | 201059_at | -1.6940 | 0.0012 | |
| GSE77861 | CTTN | 2017 | 201059_at | 0.6122 | 0.2224 | |
| GSE97050 | CTTN | 2017 | A_33_P3310780 | 0.5986 | 0.1927 | |
| SRP007169 | CTTN | 2017 | RNAseq | 0.3699 | 0.6210 | |
| SRP008496 | CTTN | 2017 | RNAseq | 0.2894 | 0.5827 | |
| SRP064894 | CTTN | 2017 | RNAseq | 1.1518 | 0.0003 | |
| SRP133303 | CTTN | 2017 | RNAseq | 1.5910 | 0.0000 | |
| SRP159526 | CTTN | 2017 | RNAseq | 2.1709 | 0.0000 | |
| SRP193095 | CTTN | 2017 | RNAseq | 1.4651 | 0.0000 | |
| SRP219564 | CTTN | 2017 | RNAseq | 1.4028 | 0.0166 | |
| TCGA | CTTN | 2017 | RNAseq | 0.2387 | 0.0061 |
Upregulated datasets: 5; Downregulated datasets: 1.
Survival by CTTN expression:
 | 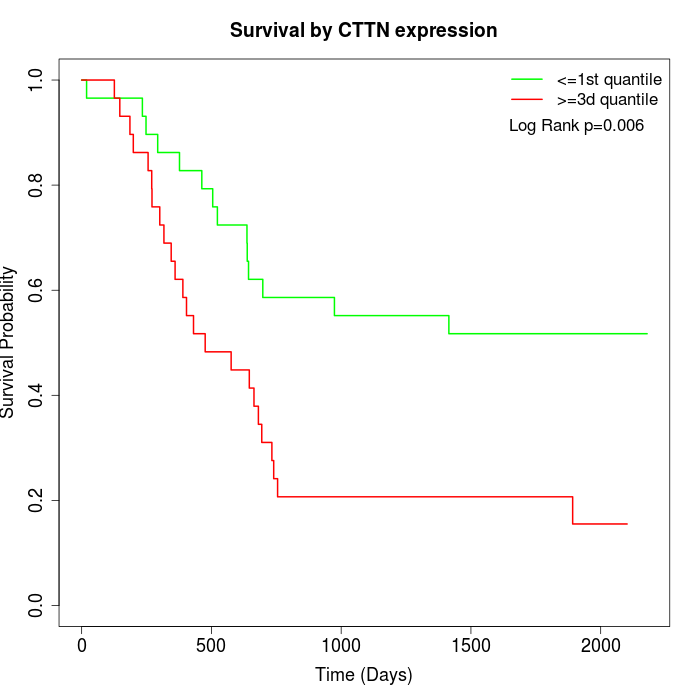 | 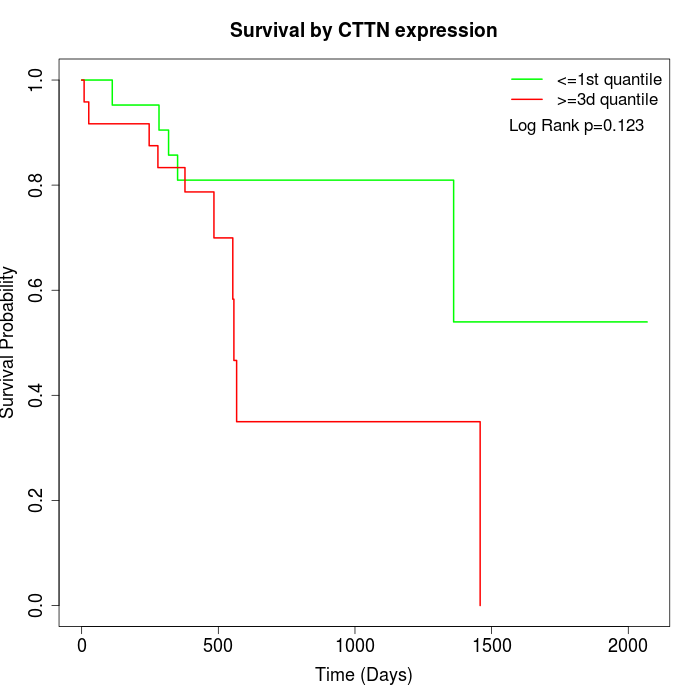 |
| GSE53622 | GSE53624 | TCGA |
Note: Click image to view full size file.
Copy number change of CTTN:
| Dataset | Gene | EntrezID | Gain | Loss | Normal | Detail |
|---|---|---|---|---|---|---|
| GSE15526 | CTTN | 2017 | 20 | 1 | 9 | |
| GSE20123 | CTTN | 2017 | 20 | 1 | 9 | |
| GSE43470 | CTTN | 2017 | 13 | 3 | 27 | |
| GSE46452 | CTTN | 2017 | 31 | 3 | 25 | |
| GSE47630 | CTTN | 2017 | 16 | 4 | 20 | |
| GSE54993 | CTTN | 2017 | 1 | 24 | 45 | |
| GSE54994 | CTTN | 2017 | 25 | 5 | 23 | |
| GSE60625 | CTTN | 2017 | 0 | 8 | 3 | |
| GSE74703 | CTTN | 2017 | 10 | 2 | 24 | |
| GSE74704 | CTTN | 2017 | 13 | 0 | 7 | |
| TCGA | CTTN | 2017 | 63 | 4 | 29 |
Total number of gains: 212; Total number of losses: 55; Total Number of normals: 221.
Somatic mutations of CTTN:
Generating mutation plots.
Highly correlated genes for CTTN:
Showing top 20/149 corelated genes with mean PCC>0.5.
| Gene1 | Gene2 | Mean PCC | Num. Datasets | Num. PCC<0 | Num. PCC>0.5 |
|---|---|---|---|---|---|
| CTTN | FADD | 0.709598 | 10 | 0 | 8 |
| CTTN | PPFIA1 | 0.709029 | 12 | 0 | 10 |
| CTTN | CDAN1 | 0.699156 | 3 | 0 | 3 |
| CTTN | CCND1 | 0.696663 | 13 | 0 | 10 |
| CTTN | TNFAIP6 | 0.685705 | 3 | 0 | 3 |
| CTTN | ANKRD16 | 0.679056 | 3 | 0 | 3 |
| CTTN | UBE3C | 0.679048 | 3 | 0 | 3 |
| CTTN | MIPOL1 | 0.672093 | 3 | 0 | 3 |
| CTTN | DSTYK | 0.662353 | 3 | 0 | 3 |
| CTTN | EIF2AK4 | 0.662209 | 3 | 0 | 3 |
| CTTN | ILKAP | 0.653108 | 4 | 0 | 4 |
| CTTN | RAB11FIP5 | 0.64599 | 4 | 0 | 4 |
| CTTN | UBE2J2 | 0.639385 | 3 | 0 | 3 |
| CTTN | OSTM1 | 0.638543 | 3 | 0 | 3 |
| CTTN | APH1B | 0.63677 | 3 | 0 | 3 |
| CTTN | ARF6 | 0.63653 | 3 | 0 | 3 |
| CTTN | ACVR1 | 0.633073 | 4 | 0 | 4 |
| CTTN | ABCB10 | 0.630438 | 3 | 0 | 3 |
| CTTN | CEP97 | 0.624762 | 3 | 0 | 3 |
| CTTN | IQCK | 0.624738 | 4 | 0 | 3 |
For details and further investigation, click here