| Full name: cytochrome P450 family 11 subfamily B member 2 | Alias Symbol: CYP11BL|CPN2|P-450C18|P450aldo|ALDOS | ||
| Type: protein-coding gene | Cytoband: 8q24.3 | ||
| Entrez ID: 1585 | HGNC ID: HGNC:2592 | Ensembl Gene: ENSG00000179142 | OMIM ID: 124080 |
| Related drugs: FADROZOLE, METOCLOPRAMIDE, OSILODROSTAT... [more] | |||
CYP11B2 involved pathways:
| KEGG pathway | Description | View |
|---|---|---|
| hsa04925 | Aldosterone synthesis and secretion |
Expression of CYP11B2:
| Dataset | Gene | EntrezID | Probe | Log2FC | Adj.pValue | Expression |
|---|---|---|---|---|---|---|
| GSE17351 | CYP11B2 | 1585 | 214630_at | -0.0590 | 0.8185 | |
| GSE20347 | CYP11B2 | 1585 | 214630_at | -0.1312 | 0.1767 | |
| GSE23400 | CYP11B2 | 1585 | 214630_at | -0.1743 | 0.0001 | |
| GSE26886 | CYP11B2 | 1585 | 214630_at | 0.1662 | 0.4556 | |
| GSE29001 | CYP11B2 | 1585 | 214630_at | -0.4808 | 0.0108 | |
| GSE38129 | CYP11B2 | 1585 | 214630_at | -0.2001 | 0.1818 | |
| GSE45670 | CYP11B2 | 1585 | 214630_at | -0.1480 | 0.1776 | |
| GSE53622 | CYP11B2 | 1585 | 55345 | 0.3874 | 0.0014 | |
| GSE53624 | CYP11B2 | 1585 | 55345 | 0.0723 | 0.5929 | |
| GSE63941 | CYP11B2 | 1585 | 214630_at | 0.0221 | 0.9209 | |
| GSE77861 | CYP11B2 | 1585 | 214630_at | -0.1124 | 0.5784 |
Upregulated datasets: 0; Downregulated datasets: 0.
Survival by CYP11B2 expression:
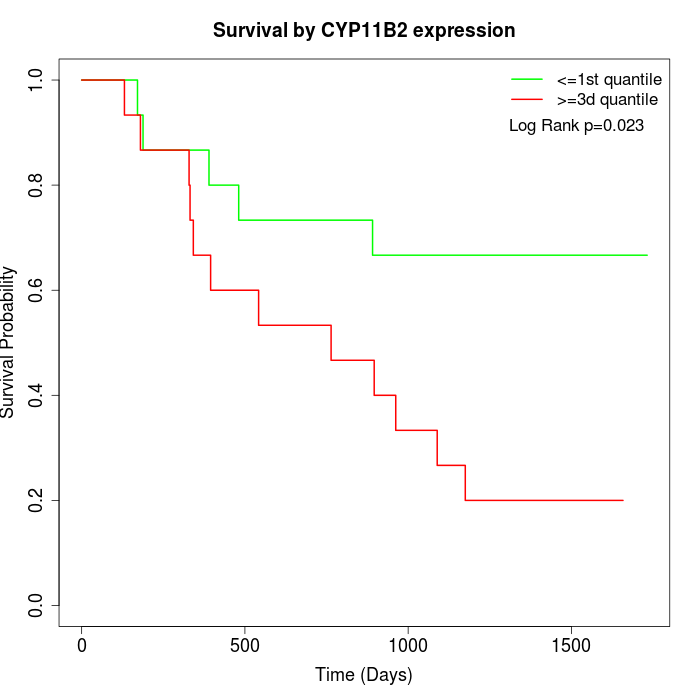 | 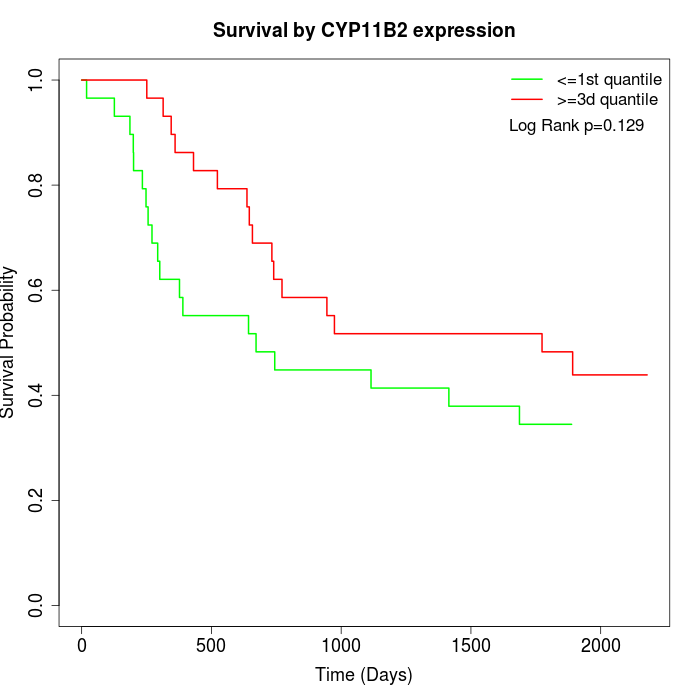 | 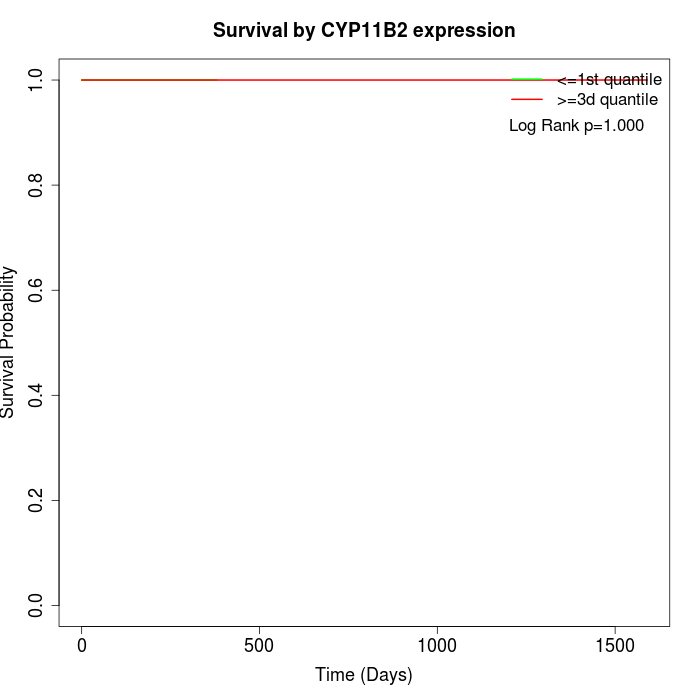 |
| GSE53622 | GSE53624 | TCGA |
Note: Click image to view full size file.
Copy number change of CYP11B2:
| Dataset | Gene | EntrezID | Gain | Loss | Normal | Detail |
|---|---|---|---|---|---|---|
| GSE15526 | CYP11B2 | 1585 | 16 | 1 | 13 | |
| GSE20123 | CYP11B2 | 1585 | 17 | 1 | 12 | |
| GSE43470 | CYP11B2 | 1585 | 17 | 2 | 24 | |
| GSE46452 | CYP11B2 | 1585 | 27 | 0 | 32 | |
| GSE47630 | CYP11B2 | 1585 | 23 | 1 | 16 | |
| GSE54993 | CYP11B2 | 1585 | 0 | 25 | 45 | |
| GSE54994 | CYP11B2 | 1585 | 39 | 1 | 13 | |
| GSE60625 | CYP11B2 | 1585 | 3 | 4 | 4 | |
| GSE74703 | CYP11B2 | 1585 | 15 | 1 | 20 | |
| GSE74704 | CYP11B2 | 1585 | 10 | 0 | 10 | |
| TCGA | CYP11B2 | 1585 | 64 | 2 | 30 |
Total number of gains: 231; Total number of losses: 38; Total Number of normals: 219.
Somatic mutations of CYP11B2:
Generating mutation plots.
Highly correlated genes for CYP11B2:
Showing top 20/779 corelated genes with mean PCC>0.5.
| Gene1 | Gene2 | Mean PCC | Num. Datasets | Num. PCC<0 | Num. PCC>0.5 |
|---|---|---|---|---|---|
| CYP11B2 | NRG1 | 0.736493 | 4 | 0 | 4 |
| CYP11B2 | PIK3R2 | 0.730117 | 4 | 0 | 4 |
| CYP11B2 | LINC00598 | 0.729671 | 3 | 0 | 3 |
| CYP11B2 | CCDC71 | 0.714599 | 7 | 0 | 6 |
| CYP11B2 | MYOG | 0.709671 | 9 | 0 | 8 |
| CYP11B2 | BRINP2 | 0.707108 | 3 | 0 | 3 |
| CYP11B2 | CLCA1 | 0.704676 | 5 | 0 | 5 |
| CYP11B2 | LTB4R2 | 0.700375 | 6 | 0 | 6 |
| CYP11B2 | SIK1 | 0.698037 | 4 | 0 | 4 |
| CYP11B2 | SHANK2-AS3 | 0.696036 | 3 | 0 | 3 |
| CYP11B2 | CDH23 | 0.693562 | 3 | 0 | 3 |
| CYP11B2 | CELF3 | 0.691559 | 8 | 0 | 7 |
| CYP11B2 | NR0B2 | 0.687731 | 3 | 0 | 3 |
| CYP11B2 | NPEPL1 | 0.6873 | 7 | 0 | 6 |
| CYP11B2 | LINC00475 | 0.685408 | 4 | 0 | 4 |
| CYP11B2 | CLDN6 | 0.684467 | 8 | 0 | 7 |
| CYP11B2 | ART1 | 0.683868 | 4 | 0 | 4 |
| CYP11B2 | AMN | 0.683042 | 7 | 0 | 6 |
| CYP11B2 | IL25 | 0.682423 | 4 | 0 | 4 |
| CYP11B2 | SPACA4 | 0.681949 | 3 | 0 | 3 |
For details and further investigation, click here