| Full name: leukotriene B4 receptor 2 | Alias Symbol: BLTR2|BLT2|JULF2|NOP9 | ||
| Type: protein-coding gene | Cytoband: 14q12 | ||
| Entrez ID: 56413 | HGNC ID: HGNC:19260 | Ensembl Gene: ENSG00000213906 | OMIM ID: 605773 |
| Related drugs: ICOMUCRET, LY-255283... [more] | |||
LTB4R2 involved pathways:
| KEGG pathway | Description | View |
|---|---|---|
| hsa04020 | Calcium signaling pathway |
Expression of LTB4R2:
| Dataset | Gene | EntrezID | Probe | Log2FC | Adj.pValue | Expression |
|---|---|---|---|---|---|---|
| GSE17351 | LTB4R2 | 56413 | 220130_x_at | 0.3815 | 0.3326 | |
| GSE20347 | LTB4R2 | 56413 | 220130_x_at | -0.1117 | 0.1615 | |
| GSE23400 | LTB4R2 | 56413 | 220130_x_at | -0.1025 | 0.0082 | |
| GSE26886 | LTB4R2 | 56413 | 220130_x_at | 0.4303 | 0.0141 | |
| GSE29001 | LTB4R2 | 56413 | 220130_x_at | -0.1462 | 0.3939 | |
| GSE38129 | LTB4R2 | 56413 | 220130_x_at | -0.0631 | 0.4780 | |
| GSE45670 | LTB4R2 | 56413 | 220130_x_at | 0.0832 | 0.4178 | |
| GSE53622 | LTB4R2 | 56413 | 70089 | -0.1637 | 0.1740 | |
| GSE53624 | LTB4R2 | 56413 | 70089 | -0.2442 | 0.0056 | |
| GSE63941 | LTB4R2 | 56413 | 220130_x_at | 0.0675 | 0.7160 | |
| GSE77861 | LTB4R2 | 56413 | 220130_x_at | 0.0504 | 0.8666 | |
| GSE97050 | LTB4R2 | 56413 | A_23_P163173 | 0.0458 | 0.8485 | |
| SRP007169 | LTB4R2 | 56413 | RNAseq | -1.0644 | 0.0056 | |
| SRP008496 | LTB4R2 | 56413 | RNAseq | -1.0340 | 0.0040 | |
| SRP064894 | LTB4R2 | 56413 | RNAseq | -0.2953 | 0.4474 | |
| SRP133303 | LTB4R2 | 56413 | RNAseq | -0.1971 | 0.5311 | |
| SRP159526 | LTB4R2 | 56413 | RNAseq | -0.7404 | 0.1848 | |
| SRP193095 | LTB4R2 | 56413 | RNAseq | -0.1759 | 0.6061 | |
| SRP219564 | LTB4R2 | 56413 | RNAseq | -1.5421 | 0.0888 | |
| TCGA | LTB4R2 | 56413 | RNAseq | 0.7363 | 0.0000 |
Upregulated datasets: 0; Downregulated datasets: 2.
Survival by LTB4R2 expression:
 | 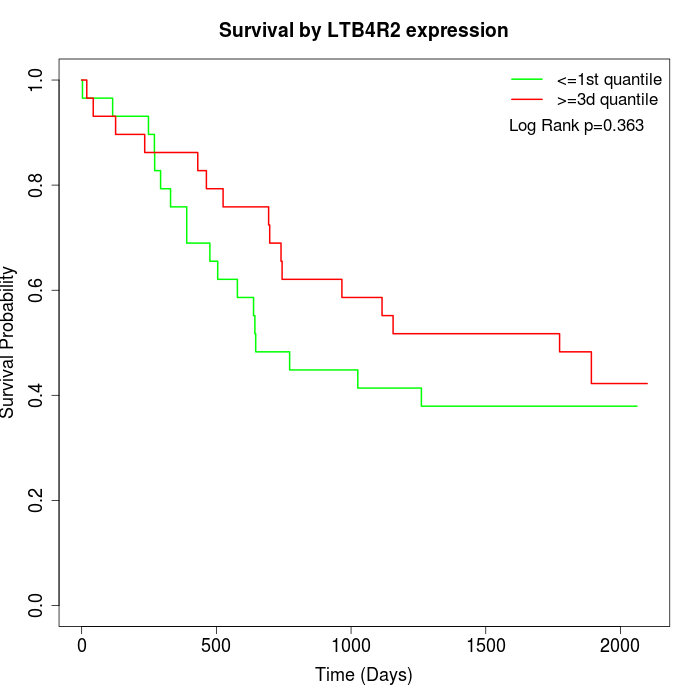 | 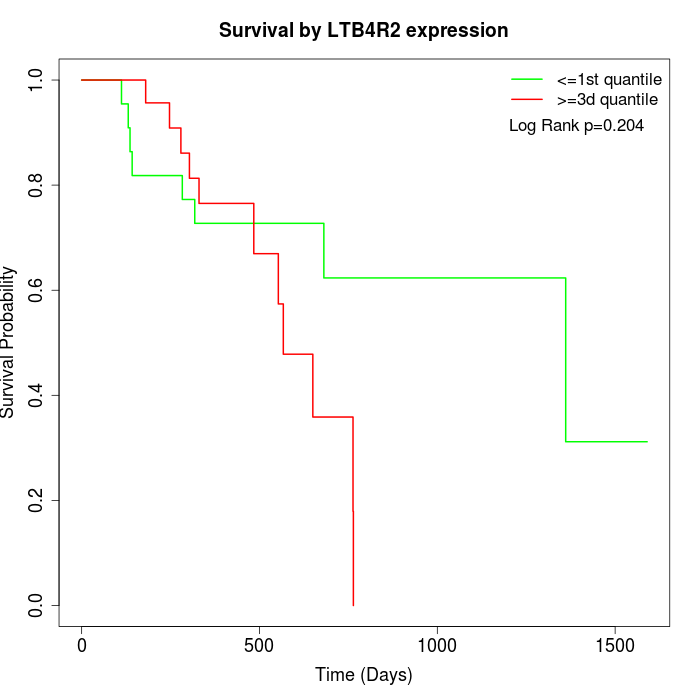 |
| GSE53622 | GSE53624 | TCGA |
Note: Click image to view full size file.
Copy number change of LTB4R2:
| Dataset | Gene | EntrezID | Gain | Loss | Normal | Detail |
|---|---|---|---|---|---|---|
| GSE15526 | LTB4R2 | 56413 | 8 | 3 | 19 | |
| GSE20123 | LTB4R2 | 56413 | 8 | 3 | 19 | |
| GSE43470 | LTB4R2 | 56413 | 8 | 2 | 33 | |
| GSE46452 | LTB4R2 | 56413 | 16 | 2 | 41 | |
| GSE47630 | LTB4R2 | 56413 | 11 | 10 | 19 | |
| GSE54993 | LTB4R2 | 56413 | 3 | 11 | 56 | |
| GSE54994 | LTB4R2 | 56413 | 18 | 5 | 30 | |
| GSE60625 | LTB4R2 | 56413 | 0 | 2 | 9 | |
| GSE74703 | LTB4R2 | 56413 | 7 | 2 | 27 | |
| GSE74704 | LTB4R2 | 56413 | 3 | 2 | 15 | |
| TCGA | LTB4R2 | 56413 | 27 | 12 | 57 |
Total number of gains: 109; Total number of losses: 54; Total Number of normals: 325.
Somatic mutations of LTB4R2:
Generating mutation plots.
Highly correlated genes for LTB4R2:
Showing top 20/624 corelated genes with mean PCC>0.5.
| Gene1 | Gene2 | Mean PCC | Num. Datasets | Num. PCC<0 | Num. PCC>0.5 |
|---|---|---|---|---|---|
| LTB4R2 | RASL10B | 0.863808 | 3 | 0 | 3 |
| LTB4R2 | SPRED3 | 0.82847 | 3 | 0 | 3 |
| LTB4R2 | ARMC5 | 0.778817 | 4 | 0 | 4 |
| LTB4R2 | STAC3 | 0.768559 | 4 | 0 | 3 |
| LTB4R2 | TFAP2E | 0.759572 | 3 | 0 | 3 |
| LTB4R2 | HOXD9 | 0.753247 | 5 | 0 | 5 |
| LTB4R2 | ISLR2 | 0.746444 | 3 | 0 | 3 |
| LTB4R2 | TMEM102 | 0.744108 | 4 | 0 | 4 |
| LTB4R2 | NPBWR1 | 0.741143 | 3 | 0 | 3 |
| LTB4R2 | RHPN1 | 0.738317 | 4 | 0 | 4 |
| LTB4R2 | CDH4 | 0.724384 | 4 | 0 | 4 |
| LTB4R2 | AMN | 0.723372 | 7 | 0 | 7 |
| LTB4R2 | SLC6A3 | 0.721239 | 4 | 0 | 4 |
| LTB4R2 | HDAC10 | 0.716561 | 4 | 0 | 3 |
| LTB4R2 | FOXD2 | 0.714704 | 3 | 0 | 3 |
| LTB4R2 | VAV2 | 0.712792 | 4 | 0 | 4 |
| LTB4R2 | SHISA4 | 0.707312 | 3 | 0 | 3 |
| LTB4R2 | APOC2 | 0.703337 | 3 | 0 | 3 |
| LTB4R2 | ARHGAP30 | 0.703281 | 4 | 0 | 3 |
| LTB4R2 | MGAT5B | 0.70248 | 5 | 0 | 4 |
For details and further investigation, click here