| Full name: tetraspanin 5 | Alias Symbol: Tspan-5|NET-4 | ||
| Type: protein-coding gene | Cytoband: 4q23 | ||
| Entrez ID: 10098 | HGNC ID: HGNC:17753 | Ensembl Gene: ENSG00000168785 | OMIM ID: 613136 |
Expression of TSPAN5:
| Dataset | Gene | EntrezID | Probe | Log2FC | Adj.pValue | Expression |
|---|---|---|---|---|---|---|
| GSE17351 | TSPAN5 | 10098 | 209890_at | 0.2276 | 0.7809 | |
| GSE20347 | TSPAN5 | 10098 | 209890_at | -0.7806 | 0.0016 | |
| GSE23400 | TSPAN5 | 10098 | 209890_at | -0.0069 | 0.9514 | |
| GSE26886 | TSPAN5 | 10098 | 225387_at | -1.1701 | 0.0000 | |
| GSE29001 | TSPAN5 | 10098 | 209890_at | -0.1706 | 0.7942 | |
| GSE38129 | TSPAN5 | 10098 | 209890_at | -0.2252 | 0.3614 | |
| GSE45670 | TSPAN5 | 10098 | 209890_at | 0.3119 | 0.0939 | |
| GSE53622 | TSPAN5 | 10098 | 53748 | -0.1974 | 0.1962 | |
| GSE53624 | TSPAN5 | 10098 | 53748 | -0.0803 | 0.4580 | |
| GSE63941 | TSPAN5 | 10098 | 225387_at | -2.8310 | 0.0043 | |
| GSE77861 | TSPAN5 | 10098 | 225387_at | -0.2952 | 0.4703 | |
| GSE97050 | TSPAN5 | 10098 | A_33_P3325349 | 0.4981 | 0.3945 | |
| SRP007169 | TSPAN5 | 10098 | RNAseq | -0.7733 | 0.1923 | |
| SRP008496 | TSPAN5 | 10098 | RNAseq | -0.9709 | 0.0142 | |
| SRP064894 | TSPAN5 | 10098 | RNAseq | -0.1122 | 0.5166 | |
| SRP133303 | TSPAN5 | 10098 | RNAseq | -0.1807 | 0.4112 | |
| SRP159526 | TSPAN5 | 10098 | RNAseq | -0.4470 | 0.2456 | |
| SRP193095 | TSPAN5 | 10098 | RNAseq | -0.4591 | 0.0370 | |
| SRP219564 | TSPAN5 | 10098 | RNAseq | -0.4476 | 0.4191 | |
| TCGA | TSPAN5 | 10098 | RNAseq | 0.1352 | 0.3870 |
Upregulated datasets: 0; Downregulated datasets: 2.
Survival by TSPAN5 expression:
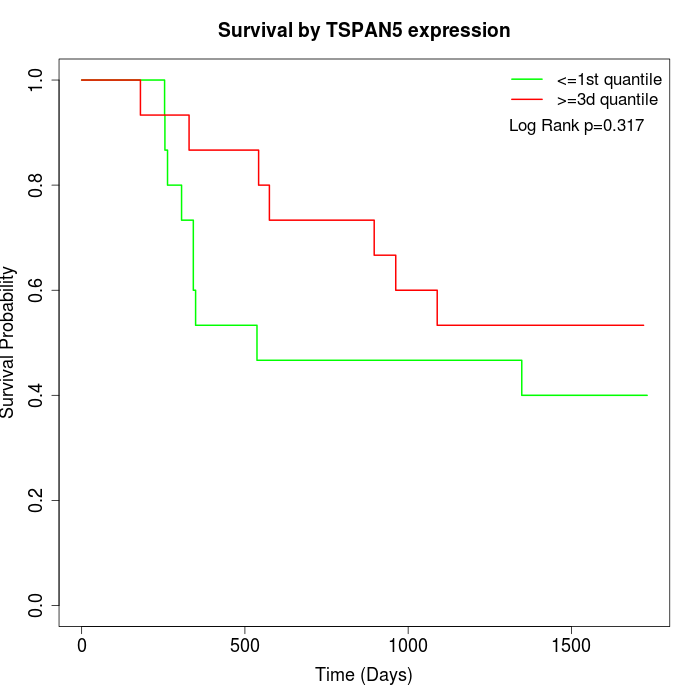 | 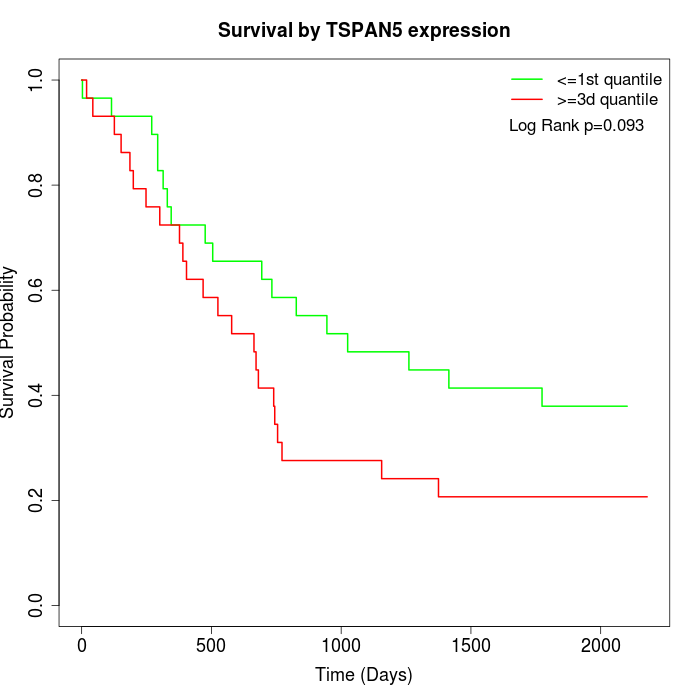 | 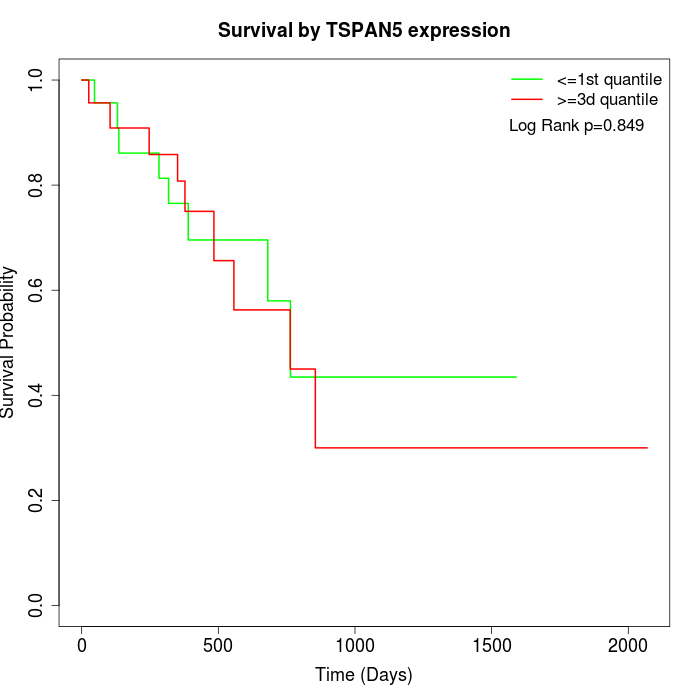 |
| GSE53622 | GSE53624 | TCGA |
Note: Click image to view full size file.
Copy number change of TSPAN5:
| Dataset | Gene | EntrezID | Gain | Loss | Normal | Detail |
|---|---|---|---|---|---|---|
| GSE15526 | TSPAN5 | 10098 | 0 | 12 | 18 | |
| GSE20123 | TSPAN5 | 10098 | 0 | 12 | 18 | |
| GSE43470 | TSPAN5 | 10098 | 0 | 15 | 28 | |
| GSE46452 | TSPAN5 | 10098 | 1 | 36 | 22 | |
| GSE47630 | TSPAN5 | 10098 | 0 | 20 | 20 | |
| GSE54993 | TSPAN5 | 10098 | 9 | 0 | 61 | |
| GSE54994 | TSPAN5 | 10098 | 1 | 11 | 41 | |
| GSE60625 | TSPAN5 | 10098 | 0 | 3 | 8 | |
| GSE74703 | TSPAN5 | 10098 | 0 | 13 | 23 | |
| GSE74704 | TSPAN5 | 10098 | 0 | 6 | 14 | |
| TCGA | TSPAN5 | 10098 | 8 | 41 | 47 |
Total number of gains: 19; Total number of losses: 169; Total Number of normals: 300.
Somatic mutations of TSPAN5:
Generating mutation plots.
Highly correlated genes for TSPAN5:
Showing top 20/568 corelated genes with mean PCC>0.5.
| Gene1 | Gene2 | Mean PCC | Num. Datasets | Num. PCC<0 | Num. PCC>0.5 |
|---|---|---|---|---|---|
| TSPAN5 | OSTC | 0.791542 | 3 | 0 | 3 |
| TSPAN5 | ZNF578 | 0.787074 | 3 | 0 | 3 |
| TSPAN5 | CCNYL1 | 0.780493 | 3 | 0 | 3 |
| TSPAN5 | ZNF211 | 0.778029 | 3 | 0 | 3 |
| TSPAN5 | MYSM1 | 0.761856 | 3 | 0 | 3 |
| TSPAN5 | HEMK1 | 0.744634 | 3 | 0 | 3 |
| TSPAN5 | CDC42SE1 | 0.742491 | 3 | 0 | 3 |
| TSPAN5 | ZNF776 | 0.731798 | 3 | 0 | 3 |
| TSPAN5 | TRAPPC6B | 0.729139 | 3 | 0 | 3 |
| TSPAN5 | RCHY1 | 0.726311 | 4 | 0 | 4 |
| TSPAN5 | ARID1B | 0.72616 | 3 | 0 | 3 |
| TSPAN5 | CLEC2B | 0.723385 | 4 | 0 | 4 |
| TSPAN5 | ERGIC1 | 0.720008 | 3 | 0 | 3 |
| TSPAN5 | IDI1 | 0.717744 | 3 | 0 | 3 |
| TSPAN5 | ZNF681 | 0.711236 | 3 | 0 | 3 |
| TSPAN5 | IMPACT | 0.707934 | 3 | 0 | 3 |
| TSPAN5 | CHM | 0.706935 | 3 | 0 | 3 |
| TSPAN5 | PDLIM2 | 0.704936 | 5 | 0 | 4 |
| TSPAN5 | LACTB | 0.703033 | 3 | 0 | 3 |
| TSPAN5 | NOP10 | 0.702497 | 3 | 0 | 3 |
For details and further investigation, click here