| Full name: ETS variant transcription factor 2 | Alias Symbol: ER71 | ||
| Type: protein-coding gene | Cytoband: 19q13.12 | ||
| Entrez ID: 2116 | HGNC ID: HGNC:3491 | Ensembl Gene: ENSG00000105672 | OMIM ID: 609358 |
Expression of ETV2:
| Dataset | Gene | EntrezID | Probe | Log2FC | Adj.pValue | Expression |
|---|---|---|---|---|---|---|
| GSE17351 | ETV2 | 2116 | 215510_at | -0.2858 | 0.3841 | |
| GSE20347 | ETV2 | 2116 | 215510_at | -0.6124 | 0.0000 | |
| GSE23400 | ETV2 | 2116 | 215510_at | -0.1442 | 0.0000 | |
| GSE26886 | ETV2 | 2116 | 215510_at | 0.0681 | 0.5760 | |
| GSE29001 | ETV2 | 2116 | 215510_at | -0.6694 | 0.0007 | |
| GSE38129 | ETV2 | 2116 | 215510_at | -0.4961 | 0.0000 | |
| GSE45670 | ETV2 | 2116 | 215510_at | -0.2605 | 0.1069 | |
| GSE53622 | ETV2 | 2116 | 83963 | -0.2288 | 0.0000 | |
| GSE53624 | ETV2 | 2116 | 83963 | -0.1515 | 0.0027 | |
| GSE63941 | ETV2 | 2116 | 215510_at | -0.1974 | 0.3539 | |
| GSE77861 | ETV2 | 2116 | 215510_at | -0.3531 | 0.0635 | |
| GSE97050 | ETV2 | 2116 | A_33_P3343106 | -0.0803 | 0.7403 | |
| SRP133303 | ETV2 | 2116 | RNAseq | -1.6928 | 0.0000 | |
| SRP159526 | ETV2 | 2116 | RNAseq | -1.5413 | 0.0000 | |
| SRP219564 | ETV2 | 2116 | RNAseq | -1.0344 | 0.1020 | |
| TCGA | ETV2 | 2116 | RNAseq | -0.1050 | 0.6351 |
Upregulated datasets: 0; Downregulated datasets: 2.
Survival by ETV2 expression:
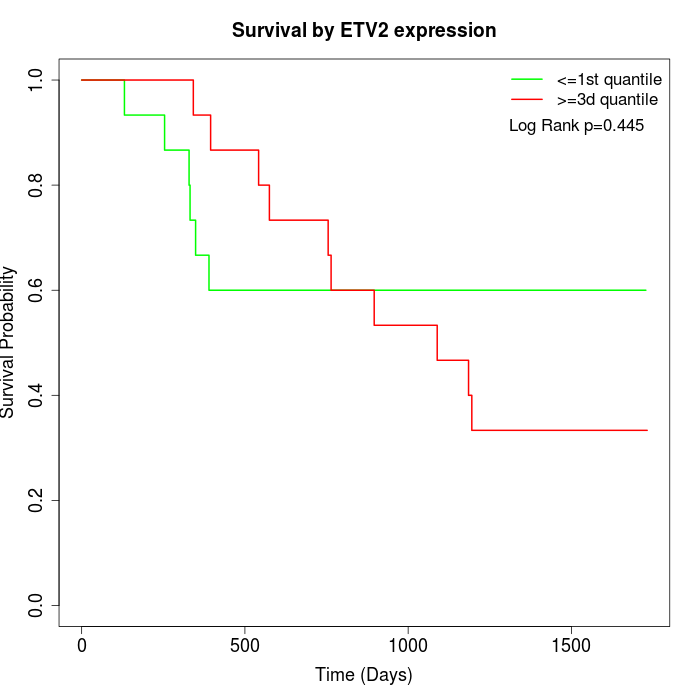 | 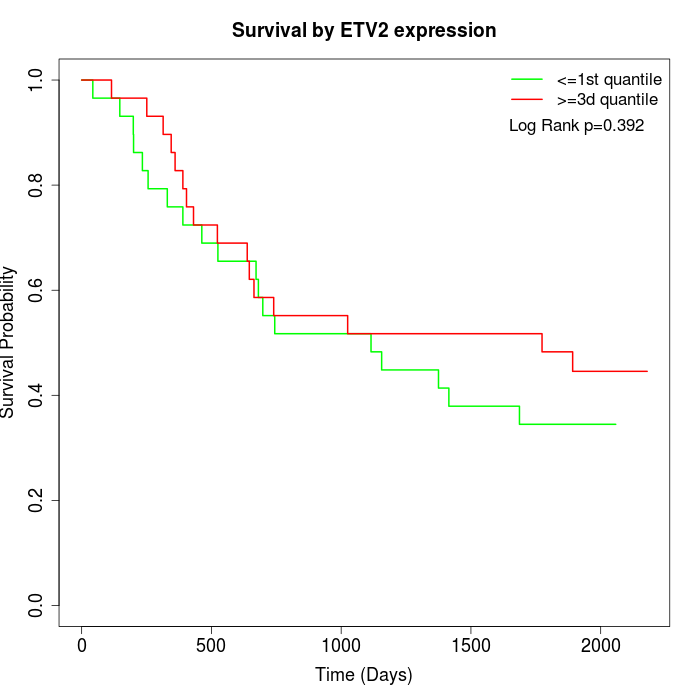 | 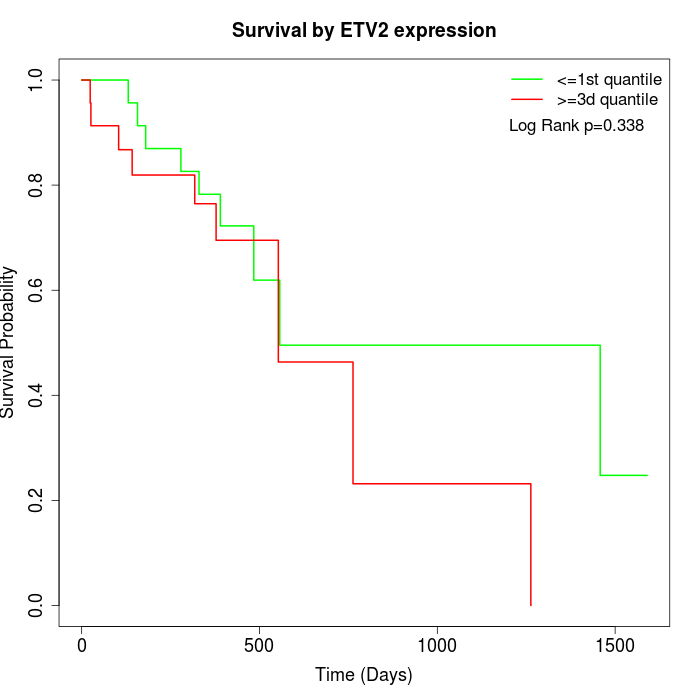 |
| GSE53622 | GSE53624 | TCGA |
Note: Click image to view full size file.
Copy number change of ETV2:
| Dataset | Gene | EntrezID | Gain | Loss | Normal | Detail |
|---|---|---|---|---|---|---|
| GSE15526 | ETV2 | 2116 | 6 | 4 | 20 | |
| GSE20123 | ETV2 | 2116 | 6 | 3 | 21 | |
| GSE43470 | ETV2 | 2116 | 3 | 7 | 33 | |
| GSE46452 | ETV2 | 2116 | 48 | 1 | 10 | |
| GSE47630 | ETV2 | 2116 | 9 | 5 | 26 | |
| GSE54993 | ETV2 | 2116 | 17 | 3 | 50 | |
| GSE54994 | ETV2 | 2116 | 7 | 9 | 37 | |
| GSE60625 | ETV2 | 2116 | 9 | 0 | 2 | |
| GSE74703 | ETV2 | 2116 | 3 | 4 | 29 | |
| GSE74704 | ETV2 | 2116 | 6 | 1 | 13 | |
| TCGA | ETV2 | 2116 | 22 | 10 | 64 |
Total number of gains: 136; Total number of losses: 47; Total Number of normals: 305.
Somatic mutations of ETV2:
Generating mutation plots.
Highly correlated genes for ETV2:
Showing top 20/1132 corelated genes with mean PCC>0.5.
| Gene1 | Gene2 | Mean PCC | Num. Datasets | Num. PCC<0 | Num. PCC>0.5 |
|---|---|---|---|---|---|
| ETV2 | CREB3L4 | 0.732415 | 3 | 0 | 3 |
| ETV2 | EVPL | 0.730556 | 7 | 0 | 7 |
| ETV2 | KRTAP5-9 | 0.723039 | 3 | 0 | 3 |
| ETV2 | RARG | 0.713169 | 7 | 0 | 7 |
| ETV2 | DUOX1 | 0.710544 | 7 | 0 | 7 |
| ETV2 | EPS8L2 | 0.703055 | 8 | 0 | 7 |
| ETV2 | TMEM61 | 0.702806 | 3 | 0 | 3 |
| ETV2 | ACAA1 | 0.699963 | 7 | 0 | 7 |
| ETV2 | SMAGP | 0.694063 | 7 | 0 | 7 |
| ETV2 | TTC9 | 0.693894 | 8 | 0 | 8 |
| ETV2 | AMN | 0.692889 | 4 | 0 | 4 |
| ETV2 | CRABP2 | 0.690376 | 6 | 0 | 5 |
| ETV2 | FAM214B | 0.689621 | 6 | 0 | 6 |
| ETV2 | C2CD2L | 0.689393 | 6 | 0 | 6 |
| ETV2 | GALR3 | 0.687295 | 9 | 0 | 8 |
| ETV2 | ARHGEF10L | 0.686875 | 9 | 0 | 7 |
| ETV2 | TPRN | 0.683132 | 4 | 0 | 3 |
| ETV2 | DHRS1 | 0.682925 | 6 | 0 | 6 |
| ETV2 | RAB5B | 0.681434 | 9 | 0 | 8 |
| ETV2 | RAB11B-AS1 | 0.681332 | 3 | 0 | 3 |
For details and further investigation, click here