| Full name: coagulation factor XI | Alias Symbol: FXI | ||
| Type: protein-coding gene | Cytoband: 4q35.2 | ||
| Entrez ID: 2160 | HGNC ID: HGNC:3529 | Ensembl Gene: ENSG00000088926 | OMIM ID: 264900 |
| Related drugs: CHEMBL273653, DEXTRAN SULFATE SODIUM, THROMBIN... [more] | |||
F11 involved pathways:
| KEGG pathway | Description | View |
|---|---|---|
| hsa04610 | Complement and coagulation cascades |
Expression of F11:
| Dataset | Gene | EntrezID | Probe | Log2FC | Adj.pValue | Expression |
|---|---|---|---|---|---|---|
| GSE17351 | F11 | 2160 | 206610_s_at | -0.0118 | 0.9732 | |
| GSE20347 | F11 | 2160 | 206610_s_at | -0.0596 | 0.4421 | |
| GSE23400 | F11 | 2160 | 206610_s_at | -0.2173 | 0.0000 | |
| GSE26886 | F11 | 2160 | 206610_s_at | -0.0324 | 0.8263 | |
| GSE29001 | F11 | 2160 | 206610_s_at | -0.1998 | 0.1672 | |
| GSE38129 | F11 | 2160 | 206610_s_at | -0.1022 | 0.1667 | |
| GSE45670 | F11 | 2160 | 206610_s_at | -0.1365 | 0.2134 | |
| GSE53622 | F11 | 2160 | 118390 | -0.0428 | 0.7940 | |
| GSE53624 | F11 | 2160 | 118390 | -0.2916 | 0.0172 | |
| GSE63941 | F11 | 2160 | 206610_s_at | 0.1489 | 0.3126 | |
| GSE77861 | F11 | 2160 | 206610_s_at | -0.2768 | 0.1091 | |
| TCGA | F11 | 2160 | RNAseq | -4.0000 | 0.0145 |
Upregulated datasets: 0; Downregulated datasets: 1.
Survival by F11 expression:
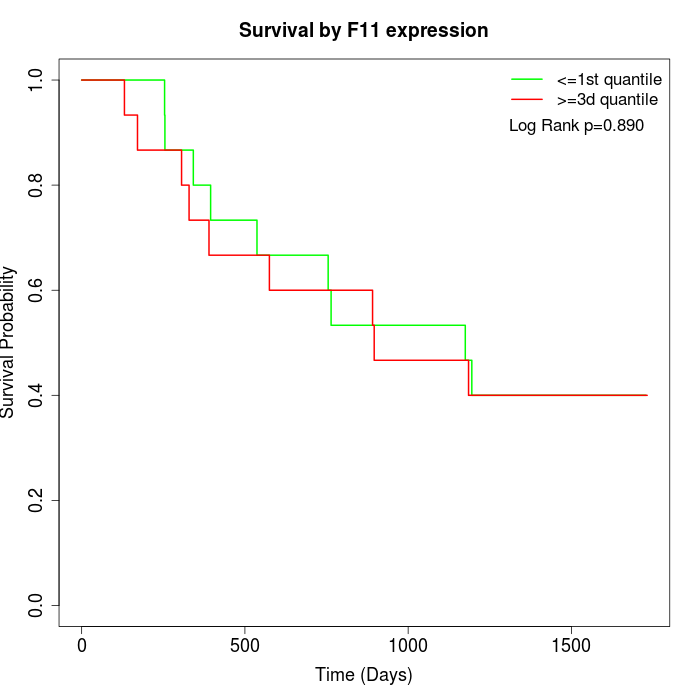 | 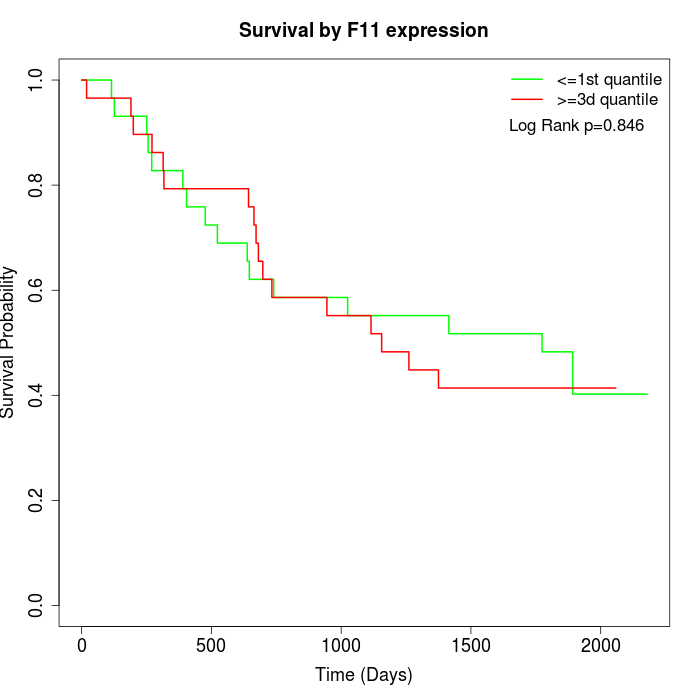 |  |
| GSE53622 | GSE53624 | TCGA |
Note: Click image to view full size file.
Copy number change of F11:
| Dataset | Gene | EntrezID | Gain | Loss | Normal | Detail |
|---|---|---|---|---|---|---|
| GSE15526 | F11 | 2160 | 2 | 11 | 17 | |
| GSE20123 | F11 | 2160 | 2 | 11 | 17 | |
| GSE43470 | F11 | 2160 | 1 | 14 | 28 | |
| GSE46452 | F11 | 2160 | 1 | 36 | 22 | |
| GSE47630 | F11 | 2160 | 0 | 22 | 18 | |
| GSE54993 | F11 | 2160 | 10 | 0 | 60 | |
| GSE54994 | F11 | 2160 | 2 | 13 | 38 | |
| GSE60625 | F11 | 2160 | 0 | 0 | 11 | |
| GSE74703 | F11 | 2160 | 1 | 11 | 24 | |
| GSE74704 | F11 | 2160 | 1 | 5 | 14 | |
| TCGA | F11 | 2160 | 10 | 34 | 52 |
Total number of gains: 30; Total number of losses: 157; Total Number of normals: 301.
Somatic mutations of F11:
Generating mutation plots.
Highly correlated genes for F11:
Showing top 20/976 corelated genes with mean PCC>0.5.
| Gene1 | Gene2 | Mean PCC | Num. Datasets | Num. PCC<0 | Num. PCC>0.5 |
|---|---|---|---|---|---|
| F11 | MMD2 | 0.725988 | 3 | 0 | 3 |
| F11 | JSRP1 | 0.724447 | 3 | 0 | 3 |
| F11 | C14orf180 | 0.716345 | 3 | 0 | 3 |
| F11 | MAG | 0.714114 | 4 | 0 | 4 |
| F11 | ASMT | 0.69966 | 4 | 0 | 4 |
| F11 | CGA | 0.698502 | 4 | 0 | 4 |
| F11 | MYCN | 0.695635 | 3 | 0 | 3 |
| F11 | C11orf16 | 0.693312 | 5 | 0 | 5 |
| F11 | LZTS1 | 0.687974 | 4 | 0 | 4 |
| F11 | OXT | 0.687216 | 3 | 0 | 3 |
| F11 | ANKFN1 | 0.686646 | 3 | 0 | 3 |
| F11 | ZNF771 | 0.686511 | 3 | 0 | 3 |
| F11 | OPRK1 | 0.682166 | 3 | 0 | 3 |
| F11 | PDE3A | 0.680624 | 3 | 0 | 3 |
| F11 | TAAR2 | 0.674446 | 3 | 0 | 3 |
| F11 | S100A1 | 0.673209 | 4 | 0 | 4 |
| F11 | OSBPL7 | 0.670759 | 4 | 0 | 3 |
| F11 | NCR2 | 0.670498 | 5 | 0 | 5 |
| F11 | GALR3 | 0.670287 | 5 | 0 | 4 |
| F11 | DRD5 | 0.66997 | 3 | 0 | 3 |
For details and further investigation, click here