| Full name: natural cytotoxicity triggering receptor 2 | Alias Symbol: NK-p44|CD336 | ||
| Type: protein-coding gene | Cytoband: 6p21.1 | ||
| Entrez ID: 9436 | HGNC ID: HGNC:6732 | Ensembl Gene: ENSG00000096264 | OMIM ID: 604531 |
NCR2 involved pathways:
| KEGG pathway | Description | View |
|---|---|---|
| hsa04650 | Natural killer cell mediated cytotoxicity |
Expression of NCR2:
| Dataset | Gene | EntrezID | Probe | Log2FC | Adj.pValue | Expression |
|---|---|---|---|---|---|---|
| GSE17351 | NCR2 | 9436 | 217493_x_at | -0.0521 | 0.8451 | |
| GSE20347 | NCR2 | 9436 | 217493_x_at | -0.0495 | 0.6884 | |
| GSE23400 | NCR2 | 9436 | 217045_x_at | -0.1350 | 0.0004 | |
| GSE26886 | NCR2 | 9436 | 217045_x_at | -0.0597 | 0.5761 | |
| GSE29001 | NCR2 | 9436 | 217493_x_at | -0.2037 | 0.2400 | |
| GSE38129 | NCR2 | 9436 | 217493_x_at | -0.1628 | 0.2375 | |
| GSE45670 | NCR2 | 9436 | 217493_x_at | 0.0616 | 0.5205 | |
| GSE53622 | NCR2 | 9436 | 90426 | -0.1997 | 0.1865 | |
| GSE53624 | NCR2 | 9436 | 82605 | -0.2064 | 0.2311 | |
| GSE63941 | NCR2 | 9436 | 217493_x_at | 0.2613 | 0.1123 | |
| GSE77861 | NCR2 | 9436 | 217493_x_at | -0.1225 | 0.2086 | |
| TCGA | NCR2 | 9436 | RNAseq | 2.1026 | 0.1576 |
Upregulated datasets: 0; Downregulated datasets: 0.
Survival by NCR2 expression:
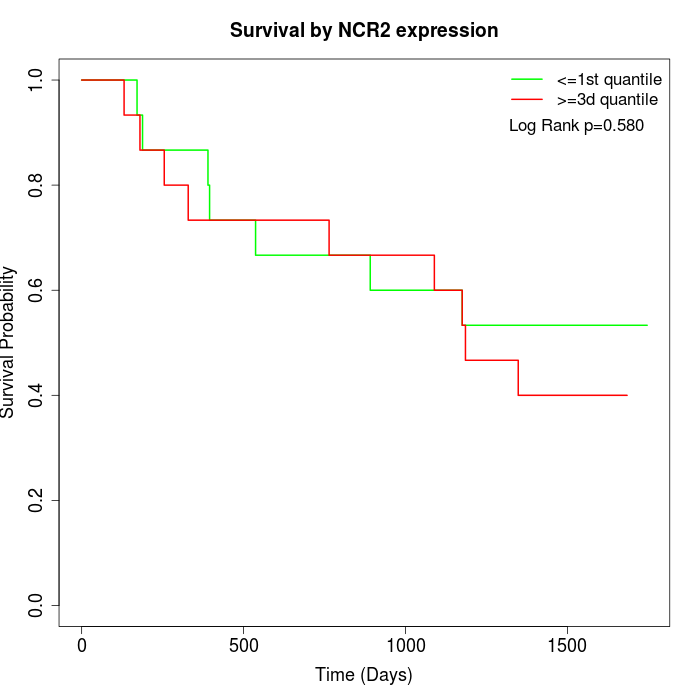 | 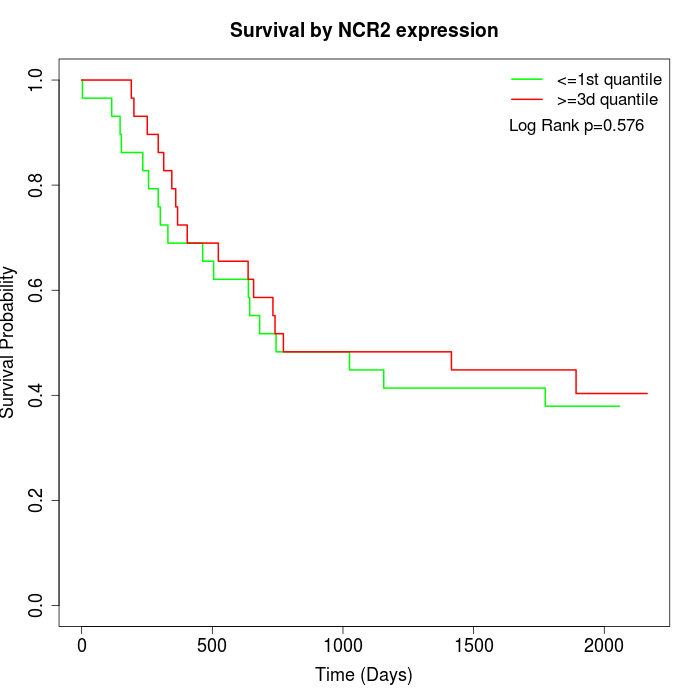 | 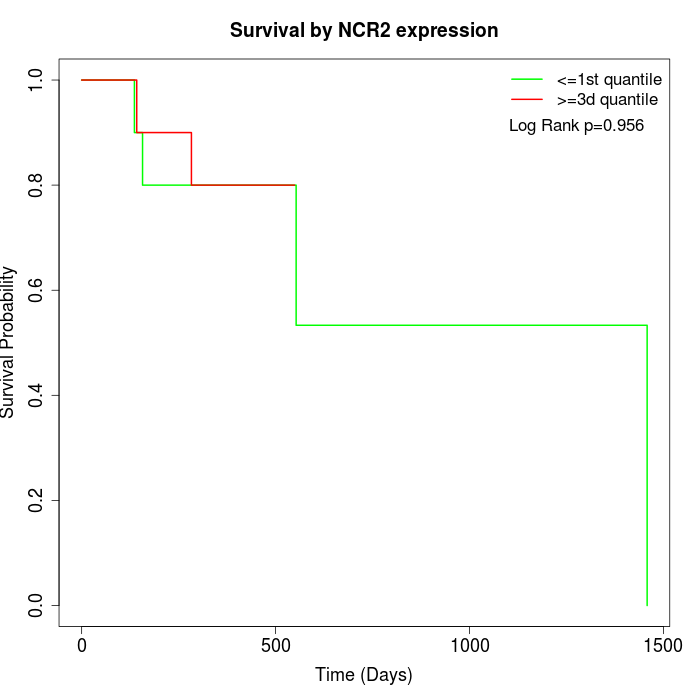 |
| GSE53622 | GSE53624 | TCGA |
Note: Click image to view full size file.
Copy number change of NCR2:
| Dataset | Gene | EntrezID | Gain | Loss | Normal | Detail |
|---|---|---|---|---|---|---|
| GSE15526 | NCR2 | 9436 | 5 | 1 | 24 | |
| GSE20123 | NCR2 | 9436 | 5 | 1 | 24 | |
| GSE43470 | NCR2 | 9436 | 6 | 0 | 37 | |
| GSE46452 | NCR2 | 9436 | 2 | 9 | 48 | |
| GSE47630 | NCR2 | 9436 | 8 | 4 | 28 | |
| GSE54993 | NCR2 | 9436 | 3 | 2 | 65 | |
| GSE54994 | NCR2 | 9436 | 11 | 4 | 38 | |
| GSE60625 | NCR2 | 9436 | 0 | 1 | 10 | |
| GSE74703 | NCR2 | 9436 | 6 | 0 | 30 | |
| GSE74704 | NCR2 | 9436 | 2 | 1 | 17 | |
| TCGA | NCR2 | 9436 | 20 | 13 | 63 |
Total number of gains: 68; Total number of losses: 36; Total Number of normals: 384.
Somatic mutations of NCR2:
Generating mutation plots.
Highly correlated genes for NCR2:
Showing top 20/1261 corelated genes with mean PCC>0.5.
| Gene1 | Gene2 | Mean PCC | Num. Datasets | Num. PCC<0 | Num. PCC>0.5 |
|---|---|---|---|---|---|
| NCR2 | DRD5 | 0.75219 | 4 | 0 | 4 |
| NCR2 | TTR | 0.751871 | 3 | 0 | 3 |
| NCR2 | PHLDB1 | 0.747175 | 5 | 0 | 4 |
| NCR2 | CGA | 0.743443 | 5 | 0 | 5 |
| NCR2 | BRINP2 | 0.741183 | 4 | 0 | 4 |
| NCR2 | IL21 | 0.733444 | 4 | 0 | 4 |
| NCR2 | CIITA | 0.720461 | 5 | 0 | 4 |
| NCR2 | RTP3 | 0.717921 | 3 | 0 | 3 |
| NCR2 | GDF2 | 0.711717 | 4 | 0 | 4 |
| NCR2 | NR5A1 | 0.71107 | 5 | 0 | 5 |
| NCR2 | IFNA10 | 0.707445 | 5 | 0 | 5 |
| NCR2 | ATG10 | 0.700318 | 5 | 0 | 4 |
| NCR2 | ATP8B3 | 0.696681 | 4 | 0 | 4 |
| NCR2 | CYP2A7 | 0.696114 | 6 | 0 | 6 |
| NCR2 | ARVCF | 0.694859 | 4 | 0 | 4 |
| NCR2 | BCAN | 0.694446 | 8 | 0 | 7 |
| NCR2 | TRAPPC9 | 0.694412 | 4 | 0 | 4 |
| NCR2 | SCGN | 0.689325 | 3 | 0 | 3 |
| NCR2 | DND1 | 0.68799 | 6 | 0 | 6 |
| NCR2 | KRT76 | 0.684223 | 5 | 0 | 5 |
For details and further investigation, click here