| Full name: S100 calcium binding protein A1 | Alias Symbol: S100-alpha | ||
| Type: protein-coding gene | Cytoband: 1q21.3 | ||
| Entrez ID: 6271 | HGNC ID: HGNC:10486 | Ensembl Gene: ENSG00000160678 | OMIM ID: 176940 |
Expression of S100A1:
| Dataset | Gene | EntrezID | Probe | Log2FC | Adj.pValue | Expression |
|---|---|---|---|---|---|---|
| GSE17351 | S100A1 | 6271 | 205334_at | -0.2435 | 0.3521 | |
| GSE20347 | S100A1 | 6271 | 205334_at | 0.0967 | 0.4086 | |
| GSE23400 | S100A1 | 6271 | 205334_at | -0.2466 | 0.0000 | |
| GSE26886 | S100A1 | 6271 | 205334_at | 0.0636 | 0.6658 | |
| GSE29001 | S100A1 | 6271 | 205334_at | -0.0610 | 0.7636 | |
| GSE38129 | S100A1 | 6271 | 205334_at | -0.2158 | 0.0437 | |
| GSE45670 | S100A1 | 6271 | 205334_at | -0.0049 | 0.9619 | |
| GSE53622 | S100A1 | 6271 | 50957 | -0.3276 | 0.0038 | |
| GSE53624 | S100A1 | 6271 | 50957 | -0.2513 | 0.1326 | |
| GSE63941 | S100A1 | 6271 | 205334_at | 0.4115 | 0.0200 | |
| GSE77861 | S100A1 | 6271 | 205334_at | -0.1398 | 0.2290 | |
| GSE97050 | S100A1 | 6271 | A_33_P3409086 | -0.1447 | 0.7153 | |
| SRP064894 | S100A1 | 6271 | RNAseq | -1.5710 | 0.0000 | |
| SRP133303 | S100A1 | 6271 | RNAseq | -1.2358 | 0.0029 | |
| SRP159526 | S100A1 | 6271 | RNAseq | -0.4410 | 0.3303 | |
| SRP219564 | S100A1 | 6271 | RNAseq | -0.7471 | 0.1027 | |
| TCGA | S100A1 | 6271 | RNAseq | -0.9453 | 0.0000 |
Upregulated datasets: 0; Downregulated datasets: 2.
Survival by S100A1 expression:
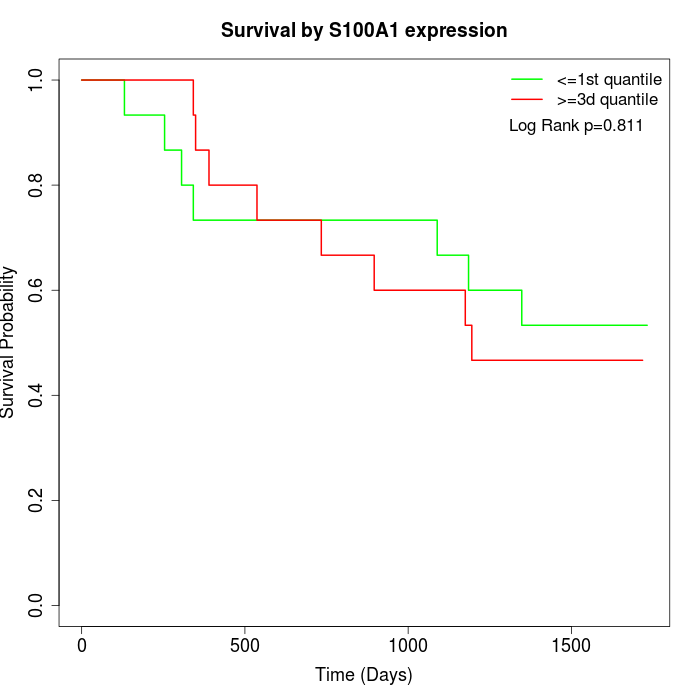 | 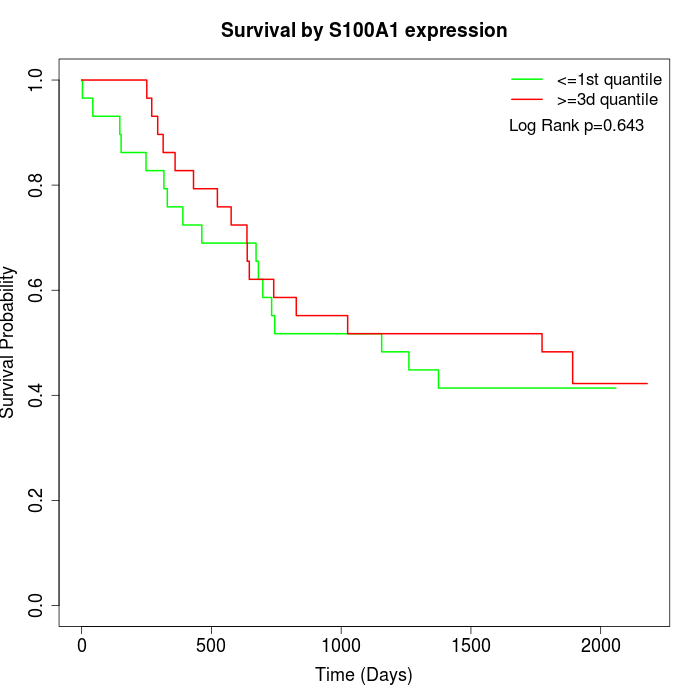 | 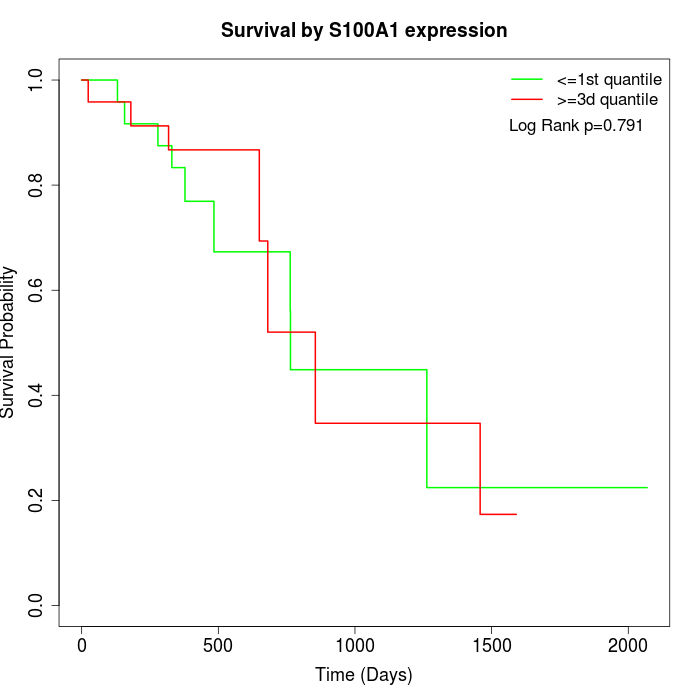 |
| GSE53622 | GSE53624 | TCGA |
Note: Click image to view full size file.
Copy number change of S100A1:
| Dataset | Gene | EntrezID | Gain | Loss | Normal | Detail |
|---|---|---|---|---|---|---|
| GSE15526 | S100A1 | 6271 | 14 | 0 | 16 | |
| GSE20123 | S100A1 | 6271 | 14 | 0 | 16 | |
| GSE43470 | S100A1 | 6271 | 7 | 2 | 34 | |
| GSE46452 | S100A1 | 6271 | 2 | 1 | 56 | |
| GSE47630 | S100A1 | 6271 | 14 | 0 | 26 | |
| GSE54993 | S100A1 | 6271 | 0 | 4 | 66 | |
| GSE54994 | S100A1 | 6271 | 16 | 0 | 37 | |
| GSE60625 | S100A1 | 6271 | 0 | 0 | 11 | |
| GSE74703 | S100A1 | 6271 | 6 | 1 | 29 | |
| GSE74704 | S100A1 | 6271 | 7 | 0 | 13 | |
| TCGA | S100A1 | 6271 | 38 | 2 | 56 |
Total number of gains: 118; Total number of losses: 10; Total Number of normals: 360.
Somatic mutations of S100A1:
Generating mutation plots.
Highly correlated genes for S100A1:
Showing top 20/615 corelated genes with mean PCC>0.5.
| Gene1 | Gene2 | Mean PCC | Num. Datasets | Num. PCC<0 | Num. PCC>0.5 |
|---|---|---|---|---|---|
| S100A1 | TSPAN16 | 0.710105 | 3 | 0 | 3 |
| S100A1 | NR2E3 | 0.683839 | 4 | 0 | 3 |
| S100A1 | THRSP | 0.681059 | 3 | 0 | 3 |
| S100A1 | CAPN11 | 0.676997 | 4 | 0 | 4 |
| S100A1 | TGM4 | 0.676458 | 6 | 0 | 5 |
| S100A1 | F11 | 0.673209 | 4 | 0 | 4 |
| S100A1 | CYP2A7 | 0.671344 | 5 | 0 | 5 |
| S100A1 | CADM3 | 0.667114 | 7 | 0 | 6 |
| S100A1 | PGLYRP1 | 0.666246 | 5 | 0 | 4 |
| S100A1 | DEFB108B | 0.664822 | 3 | 0 | 3 |
| S100A1 | KCNJ4 | 0.662406 | 4 | 0 | 3 |
| S100A1 | SSPO | 0.659906 | 4 | 0 | 4 |
| S100A1 | SLC25A34 | 0.659856 | 3 | 0 | 3 |
| S100A1 | OR2W1 | 0.659535 | 4 | 0 | 4 |
| S100A1 | MIR4755 | 0.654415 | 3 | 0 | 3 |
| S100A1 | LRTM2 | 0.652368 | 4 | 0 | 4 |
| S100A1 | GABRD | 0.647778 | 4 | 0 | 4 |
| S100A1 | TBX6 | 0.646445 | 3 | 0 | 3 |
| S100A1 | ADAM30 | 0.643887 | 3 | 0 | 3 |
| S100A1 | IGH | 0.638939 | 5 | 0 | 4 |
For details and further investigation, click here