| Full name: fatty acid binding protein 1 | Alias Symbol: L-FABP | ||
| Type: protein-coding gene | Cytoband: 2p11.2 | ||
| Entrez ID: 2168 | HGNC ID: HGNC:3555 | Ensembl Gene: ENSG00000163586 | OMIM ID: 134650 |
| Related drugs: CLOFIBRATE, DEXAMETHASONE... [more] | |||
FABP1 involved pathways:
| KEGG pathway | Description | View |
|---|---|---|
| hsa03320 | PPAR signaling pathway |
Expression of FABP1:
| Dataset | Gene | EntrezID | Probe | Log2FC | Adj.pValue | Expression |
|---|---|---|---|---|---|---|
| GSE17351 | FABP1 | 2168 | 231693_at | -0.0788 | 0.8361 | |
| GSE20347 | FABP1 | 2168 | 205892_s_at | -0.0022 | 0.9710 | |
| GSE23400 | FABP1 | 2168 | 205892_s_at | -0.0211 | 0.4157 | |
| GSE26886 | FABP1 | 2168 | 231693_at | 0.0365 | 0.7706 | |
| GSE29001 | FABP1 | 2168 | 205892_s_at | -0.0946 | 0.2684 | |
| GSE38129 | FABP1 | 2168 | 205892_s_at | -0.0654 | 0.2354 | |
| GSE45670 | FABP1 | 2168 | 231693_at | 0.0701 | 0.5702 | |
| GSE53622 | FABP1 | 2168 | 4217 | 0.1411 | 0.1795 | |
| GSE53624 | FABP1 | 2168 | 4217 | 0.0299 | 0.8544 | |
| GSE63941 | FABP1 | 2168 | 231693_at | 0.0641 | 0.6330 | |
| GSE77861 | FABP1 | 2168 | 231693_at | -0.1082 | 0.3816 | |
| TCGA | FABP1 | 2168 | RNAseq | 1.1044 | 0.5923 |
Upregulated datasets: 0; Downregulated datasets: 0.
Survival by FABP1 expression:
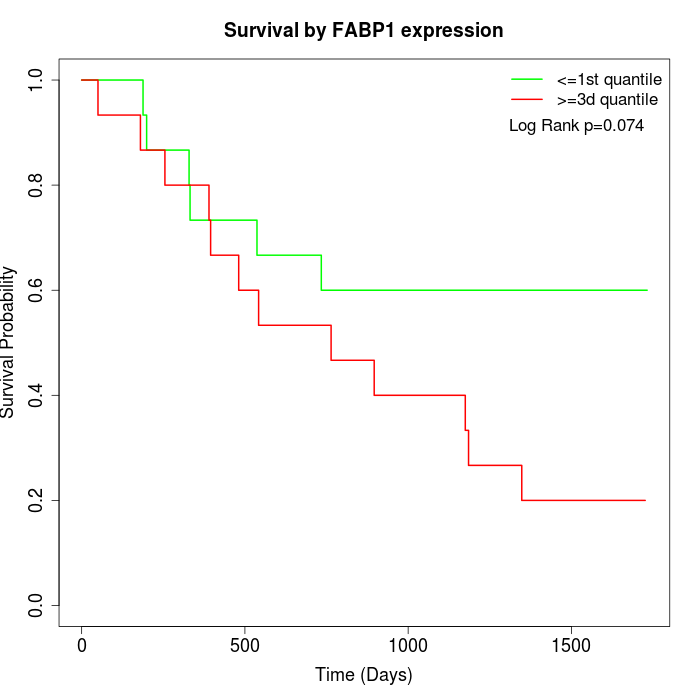 | 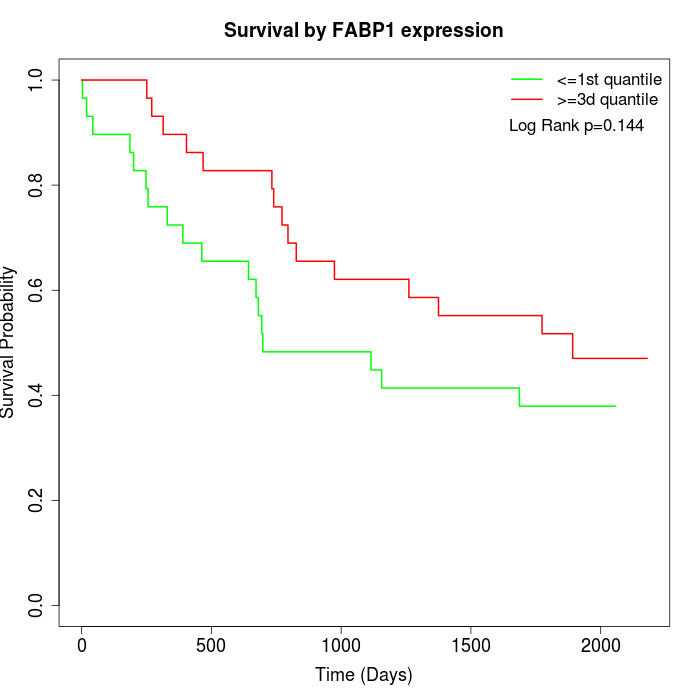 | 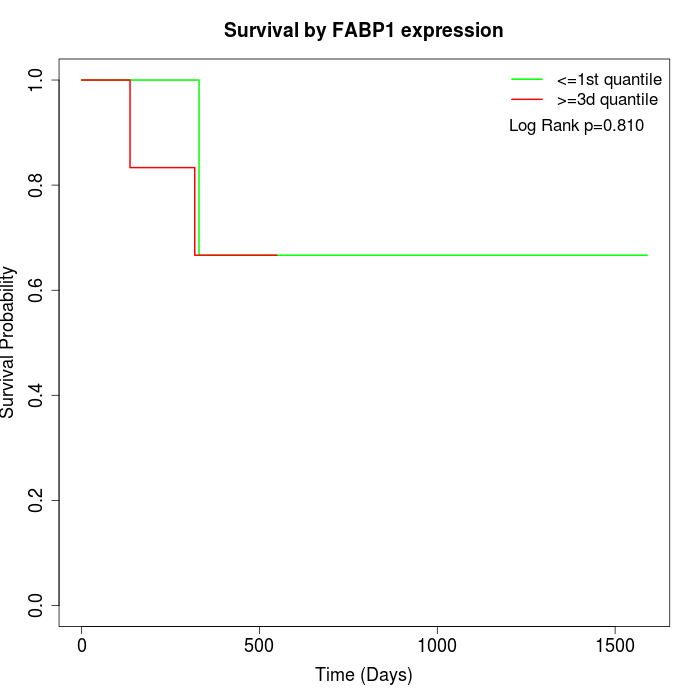 |
| GSE53622 | GSE53624 | TCGA |
Note: Click image to view full size file.
Copy number change of FABP1:
| Dataset | Gene | EntrezID | Gain | Loss | Normal | Detail |
|---|---|---|---|---|---|---|
| GSE15526 | FABP1 | 2168 | 9 | 2 | 19 | |
| GSE20123 | FABP1 | 2168 | 9 | 2 | 19 | |
| GSE43470 | FABP1 | 2168 | 3 | 2 | 38 | |
| GSE46452 | FABP1 | 2168 | 2 | 3 | 54 | |
| GSE47630 | FABP1 | 2168 | 7 | 0 | 33 | |
| GSE54993 | FABP1 | 2168 | 0 | 6 | 64 | |
| GSE54994 | FABP1 | 2168 | 10 | 0 | 43 | |
| GSE60625 | FABP1 | 2168 | 0 | 3 | 8 | |
| GSE74703 | FABP1 | 2168 | 3 | 1 | 32 | |
| GSE74704 | FABP1 | 2168 | 7 | 0 | 13 | |
| TCGA | FABP1 | 2168 | 34 | 4 | 58 |
Total number of gains: 84; Total number of losses: 23; Total Number of normals: 381.
Somatic mutations of FABP1:
Generating mutation plots.
Highly correlated genes for FABP1:
Showing top 20/154 corelated genes with mean PCC>0.5.
| Gene1 | Gene2 | Mean PCC | Num. Datasets | Num. PCC<0 | Num. PCC>0.5 |
|---|---|---|---|---|---|
| FABP1 | GML | 0.715896 | 3 | 0 | 3 |
| FABP1 | LHX3 | 0.675318 | 3 | 0 | 3 |
| FABP1 | ZC4H2 | 0.667828 | 3 | 0 | 3 |
| FABP1 | NLGN3 | 0.66716 | 4 | 0 | 3 |
| FABP1 | ROPN1L | 0.666929 | 3 | 0 | 3 |
| FABP1 | MEPE | 0.655711 | 3 | 0 | 3 |
| FABP1 | CASC17 | 0.647691 | 3 | 0 | 3 |
| FABP1 | STAC2 | 0.647542 | 3 | 0 | 3 |
| FABP1 | LZTS1 | 0.643553 | 3 | 0 | 3 |
| FABP1 | ITGB3 | 0.640496 | 4 | 0 | 3 |
| FABP1 | DOK2 | 0.636963 | 3 | 0 | 3 |
| FABP1 | ZNF280B | 0.629187 | 4 | 0 | 3 |
| FABP1 | GNG3 | 0.625321 | 3 | 0 | 3 |
| FABP1 | SNAP25 | 0.622521 | 4 | 0 | 3 |
| FABP1 | TCL1A | 0.612553 | 4 | 0 | 3 |
| FABP1 | S100A5 | 0.611768 | 3 | 0 | 3 |
| FABP1 | OR1G1 | 0.607756 | 5 | 0 | 3 |
| FABP1 | MUC2 | 0.604587 | 3 | 0 | 3 |
| FABP1 | VPREB3 | 0.604537 | 3 | 0 | 3 |
| FABP1 | CCDC36 | 0.604317 | 3 | 0 | 3 |
For details and further investigation, click here