| Full name: T cell leukemia/lymphoma 1A | Alias Symbol: TCL1 | ||
| Type: protein-coding gene | Cytoband: 14q32.13 | ||
| Entrez ID: 8115 | HGNC ID: HGNC:11648 | Ensembl Gene: ENSG00000100721 | OMIM ID: 186960 |
TCL1A involved pathways:
| KEGG pathway | Description | View |
|---|---|---|
| hsa04151 | PI3K-Akt signaling pathway |
Expression of TCL1A:
| Dataset | Gene | EntrezID | Probe | Log2FC | Adj.pValue | Expression |
|---|---|---|---|---|---|---|
| GSE17351 | TCL1A | 8115 | 209995_s_at | -0.1540 | 0.9325 | |
| GSE20347 | TCL1A | 8115 | 209995_s_at | -0.1051 | 0.4103 | |
| GSE23400 | TCL1A | 8115 | 209995_s_at | -0.1647 | 0.0139 | |
| GSE26886 | TCL1A | 8115 | 209995_s_at | -0.3965 | 0.0383 | |
| GSE29001 | TCL1A | 8115 | 209995_s_at | -0.1890 | 0.2540 | |
| GSE38129 | TCL1A | 8115 | 39318_at | -0.2465 | 0.3840 | |
| GSE45670 | TCL1A | 8115 | 209995_s_at | -0.1034 | 0.6706 | |
| GSE63941 | TCL1A | 8115 | 39318_at | 0.0516 | 0.7011 | |
| GSE77861 | TCL1A | 8115 | 209995_s_at | -0.1370 | 0.3318 | |
| GSE97050 | TCL1A | 8115 | A_23_P357717 | 0.8436 | 0.1808 | |
| TCGA | TCL1A | 8115 | RNAseq | -0.2135 | 0.8202 |
Upregulated datasets: 0; Downregulated datasets: 0.
Survival by TCL1A expression:
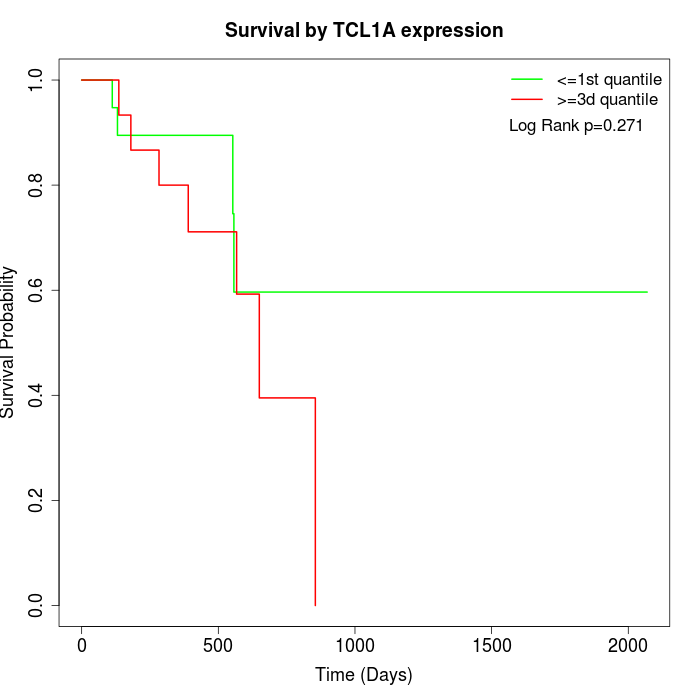 |
| TCGA |
Note: Click image to view full size file.
Copy number change of TCL1A:
| Dataset | Gene | EntrezID | Gain | Loss | Normal | Detail |
|---|---|---|---|---|---|---|
| GSE15526 | TCL1A | 8115 | 10 | 4 | 16 | |
| GSE20123 | TCL1A | 8115 | 10 | 3 | 17 | |
| GSE43470 | TCL1A | 8115 | 8 | 3 | 32 | |
| GSE46452 | TCL1A | 8115 | 16 | 3 | 40 | |
| GSE47630 | TCL1A | 8115 | 11 | 8 | 21 | |
| GSE54993 | TCL1A | 8115 | 3 | 8 | 59 | |
| GSE54994 | TCL1A | 8115 | 21 | 4 | 28 | |
| GSE60625 | TCL1A | 8115 | 0 | 2 | 9 | |
| GSE74703 | TCL1A | 8115 | 6 | 3 | 27 | |
| GSE74704 | TCL1A | 8115 | 6 | 3 | 11 | |
| TCGA | TCL1A | 8115 | 30 | 19 | 47 |
Total number of gains: 121; Total number of losses: 60; Total Number of normals: 307.
Somatic mutations of TCL1A:
Generating mutation plots.
Highly correlated genes for TCL1A:
Showing top 20/377 corelated genes with mean PCC>0.5.
| Gene1 | Gene2 | Mean PCC | Num. Datasets | Num. PCC<0 | Num. PCC>0.5 |
|---|---|---|---|---|---|
| TCL1A | CD79B | 0.748976 | 6 | 0 | 6 |
| TCL1A | SLAMF6 | 0.729941 | 3 | 0 | 3 |
| TCL1A | P2RY8 | 0.714285 | 3 | 0 | 3 |
| TCL1A | MS4A1 | 0.701685 | 8 | 0 | 8 |
| TCL1A | CCL11 | 0.694582 | 3 | 0 | 3 |
| TCL1A | PNOC | 0.68238 | 7 | 0 | 6 |
| TCL1A | RAC2 | 0.681538 | 3 | 0 | 3 |
| TCL1A | CD19 | 0.681299 | 10 | 0 | 7 |
| TCL1A | BANK1 | 0.679544 | 7 | 0 | 6 |
| TCL1A | IQGAP3 | 0.679061 | 3 | 0 | 3 |
| TCL1A | HVCN1 | 0.678144 | 5 | 0 | 5 |
| TCL1A | STAP1 | 0.677379 | 8 | 0 | 6 |
| TCL1A | MED24 | 0.676333 | 3 | 0 | 3 |
| TCL1A | FCRL5 | 0.675264 | 5 | 0 | 4 |
| TCL1A | SPAG11A | 0.669484 | 3 | 0 | 3 |
| TCL1A | FCRL1 | 0.667603 | 5 | 0 | 5 |
| TCL1A | VPREB3 | 0.666411 | 7 | 0 | 6 |
| TCL1A | TLR10 | 0.662743 | 4 | 0 | 3 |
| TCL1A | FCRLA | 0.66263 | 6 | 0 | 4 |
| TCL1A | CDH7 | 0.658342 | 3 | 0 | 3 |
For details and further investigation, click here