| Full name: F-box and leucine rich repeat protein 14 | Alias Symbol: MGC40195|Fbl14 | ||
| Type: protein-coding gene | Cytoband: 12p13.33 | ||
| Entrez ID: 144699 | HGNC ID: HGNC:28624 | Ensembl Gene: ENSG00000171823 | OMIM ID: 609081 |
Expression of FBXL14:
| Dataset | Gene | EntrezID | Probe | Log2FC | Adj.pValue | Expression |
|---|---|---|---|---|---|---|
| GSE17351 | FBXL14 | 144699 | 213145_at | -0.1416 | 0.8152 | |
| GSE20347 | FBXL14 | 144699 | 213145_at | -0.2378 | 0.2657 | |
| GSE23400 | FBXL14 | 144699 | 213145_at | -0.0058 | 0.9527 | |
| GSE26886 | FBXL14 | 144699 | 213145_at | -0.6072 | 0.1009 | |
| GSE29001 | FBXL14 | 144699 | 213145_at | -0.0386 | 0.8966 | |
| GSE38129 | FBXL14 | 144699 | 213145_at | -0.1966 | 0.2197 | |
| GSE45670 | FBXL14 | 144699 | 213145_at | -0.2155 | 0.4890 | |
| GSE53622 | FBXL14 | 144699 | 34071 | -0.7423 | 0.0000 | |
| GSE53624 | FBXL14 | 144699 | 34071 | -0.5026 | 0.0000 | |
| GSE63941 | FBXL14 | 144699 | 213145_at | 0.5485 | 0.1862 | |
| GSE77861 | FBXL14 | 144699 | 213145_at | -0.1874 | 0.6264 | |
| GSE97050 | FBXL14 | 144699 | A_23_P36724 | 0.0065 | 0.9828 | |
| SRP007169 | FBXL14 | 144699 | RNAseq | -1.1494 | 0.0092 | |
| SRP008496 | FBXL14 | 144699 | RNAseq | -0.7086 | 0.0183 | |
| SRP064894 | FBXL14 | 144699 | RNAseq | -0.8100 | 0.0007 | |
| SRP133303 | FBXL14 | 144699 | RNAseq | -0.3289 | 0.1507 | |
| SRP159526 | FBXL14 | 144699 | RNAseq | -0.5150 | 0.2032 | |
| SRP193095 | FBXL14 | 144699 | RNAseq | -0.5083 | 0.0002 | |
| SRP219564 | FBXL14 | 144699 | RNAseq | -0.3849 | 0.3169 | |
| TCGA | FBXL14 | 144699 | RNAseq | -0.1515 | 0.0231 |
Upregulated datasets: 0; Downregulated datasets: 1.
Survival by FBXL14 expression:
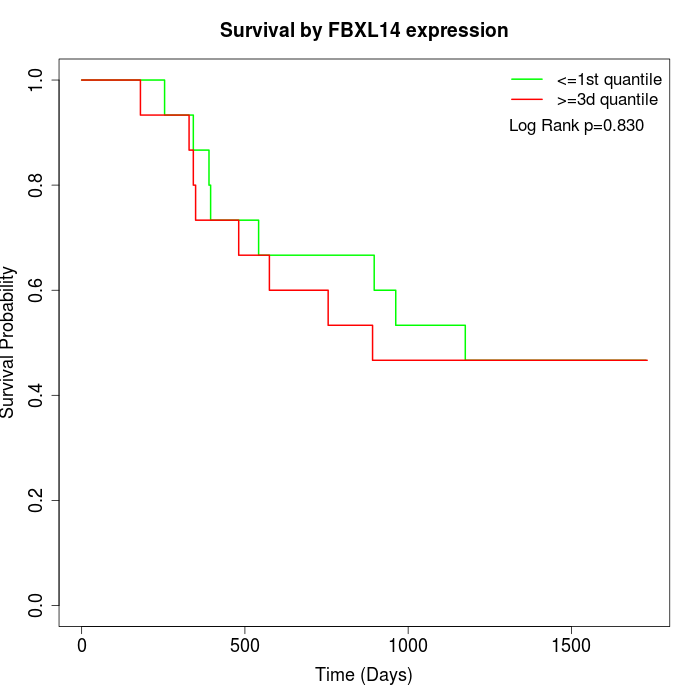 | 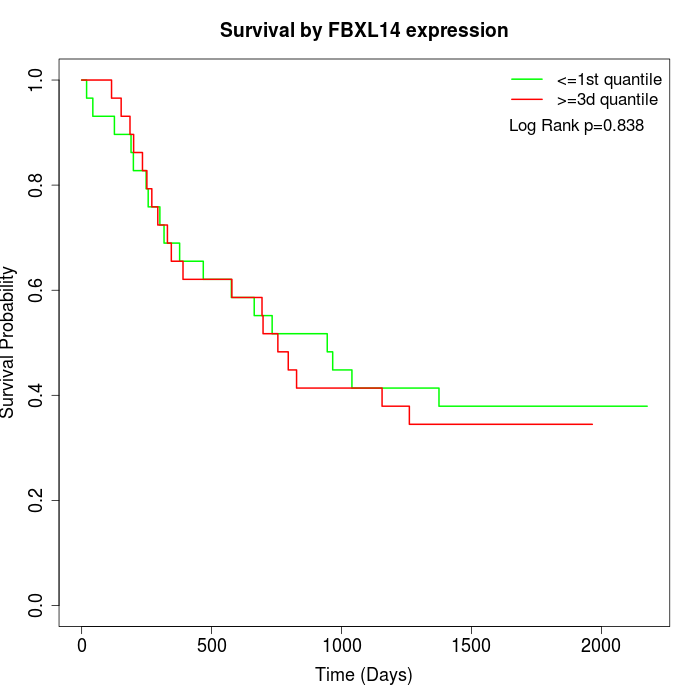 | 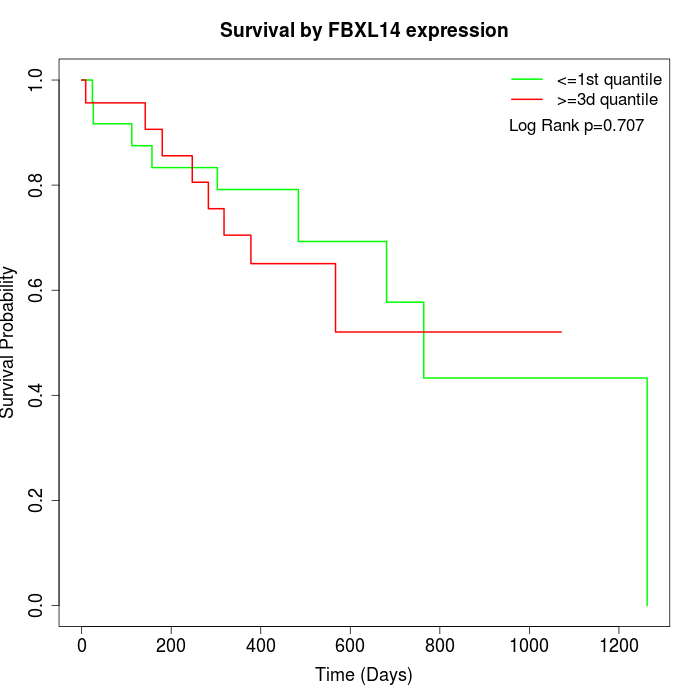 |
| GSE53622 | GSE53624 | TCGA |
Note: Click image to view full size file.
Copy number change of FBXL14:
| Dataset | Gene | EntrezID | Gain | Loss | Normal | Detail |
|---|---|---|---|---|---|---|
| GSE15526 | FBXL14 | 144699 | 7 | 4 | 19 | |
| GSE20123 | FBXL14 | 144699 | 7 | 4 | 19 | |
| GSE43470 | FBXL14 | 144699 | 11 | 3 | 29 | |
| GSE46452 | FBXL14 | 144699 | 10 | 1 | 48 | |
| GSE47630 | FBXL14 | 144699 | 12 | 2 | 26 | |
| GSE54993 | FBXL14 | 144699 | 1 | 10 | 59 | |
| GSE54994 | FBXL14 | 144699 | 10 | 2 | 41 | |
| GSE60625 | FBXL14 | 144699 | 0 | 1 | 10 | |
| GSE74703 | FBXL14 | 144699 | 10 | 2 | 24 | |
| GSE74704 | FBXL14 | 144699 | 4 | 2 | 14 | |
| TCGA | FBXL14 | 144699 | 37 | 9 | 50 |
Total number of gains: 109; Total number of losses: 40; Total Number of normals: 339.
Somatic mutations of FBXL14:
Generating mutation plots.
Highly correlated genes for FBXL14:
Showing top 20/352 corelated genes with mean PCC>0.5.
| Gene1 | Gene2 | Mean PCC | Num. Datasets | Num. PCC<0 | Num. PCC>0.5 |
|---|---|---|---|---|---|
| FBXL14 | ZNF564 | 0.79902 | 3 | 0 | 3 |
| FBXL14 | YIPF3 | 0.781172 | 3 | 0 | 3 |
| FBXL14 | ZNF227 | 0.781003 | 3 | 0 | 3 |
| FBXL14 | IFIT5 | 0.76984 | 3 | 0 | 3 |
| FBXL14 | LSM14A | 0.76949 | 3 | 0 | 3 |
| FBXL14 | ARFGAP2 | 0.749852 | 3 | 0 | 3 |
| FBXL14 | SYPL1 | 0.743151 | 3 | 0 | 3 |
| FBXL14 | TET2 | 0.733978 | 3 | 0 | 3 |
| FBXL14 | BAG1 | 0.733666 | 3 | 0 | 3 |
| FBXL14 | GTPBP6 | 0.730524 | 3 | 0 | 3 |
| FBXL14 | PIK3C2A | 0.729029 | 4 | 0 | 4 |
| FBXL14 | ANKRD49 | 0.728914 | 4 | 0 | 4 |
| FBXL14 | HLA-DQB1 | 0.721006 | 3 | 0 | 3 |
| FBXL14 | ZNF136 | 0.720394 | 3 | 0 | 3 |
| FBXL14 | ZNF41 | 0.720175 | 3 | 0 | 3 |
| FBXL14 | NUB1 | 0.719851 | 4 | 0 | 3 |
| FBXL14 | ZFP3 | 0.718787 | 5 | 0 | 5 |
| FBXL14 | ARL6 | 0.718631 | 4 | 0 | 4 |
| FBXL14 | COG6 | 0.717464 | 3 | 0 | 3 |
| FBXL14 | ANAPC16 | 0.715927 | 4 | 0 | 4 |
For details and further investigation, click here