| Full name: LSM14A mRNA processing body assembly factor | Alias Symbol: DKFZP434D1335|RAP55A|RAP55 | ||
| Type: protein-coding gene | Cytoband: 19q13.11 | ||
| Entrez ID: 26065 | HGNC ID: HGNC:24489 | Ensembl Gene: ENSG00000257103 | OMIM ID: 610677 |
Screen Evidence:
| |||
Expression of LSM14A:
| Dataset | Gene | EntrezID | Probe | Log2FC | Adj.pValue | Expression |
|---|---|---|---|---|---|---|
| GSE17351 | LSM14A | 26065 | 212131_at | -0.0113 | 0.9822 | |
| GSE20347 | LSM14A | 26065 | 212131_at | 0.3371 | 0.1552 | |
| GSE23400 | LSM14A | 26065 | 212131_at | 0.4588 | 0.0004 | |
| GSE26886 | LSM14A | 26065 | 212132_at | -0.5618 | 0.0006 | |
| GSE29001 | LSM14A | 26065 | 212132_at | 0.3091 | 0.3185 | |
| GSE38129 | LSM14A | 26065 | 212131_at | 0.1977 | 0.3063 | |
| GSE45670 | LSM14A | 26065 | 212131_at | -0.2743 | 0.2032 | |
| GSE53622 | LSM14A | 26065 | 66672 | 0.1017 | 0.0375 | |
| GSE53624 | LSM14A | 26065 | 66672 | 0.1937 | 0.0000 | |
| GSE63941 | LSM14A | 26065 | 212132_at | 0.0409 | 0.9332 | |
| GSE77861 | LSM14A | 26065 | 212132_at | 0.1639 | 0.4830 | |
| GSE97050 | LSM14A | 26065 | A_24_P365327 | -0.1059 | 0.5726 | |
| SRP007169 | LSM14A | 26065 | RNAseq | 0.0124 | 0.9749 | |
| SRP008496 | LSM14A | 26065 | RNAseq | -0.0000 | 0.9999 | |
| SRP064894 | LSM14A | 26065 | RNAseq | 0.0949 | 0.5463 | |
| SRP133303 | LSM14A | 26065 | RNAseq | 0.0876 | 0.6460 | |
| SRP159526 | LSM14A | 26065 | RNAseq | 0.4648 | 0.0451 | |
| SRP193095 | LSM14A | 26065 | RNAseq | 0.0026 | 0.9787 | |
| SRP219564 | LSM14A | 26065 | RNAseq | -0.1418 | 0.5380 | |
| TCGA | LSM14A | 26065 | RNAseq | 0.0815 | 0.0622 |
Upregulated datasets: 0; Downregulated datasets: 0.
Survival by LSM14A expression:
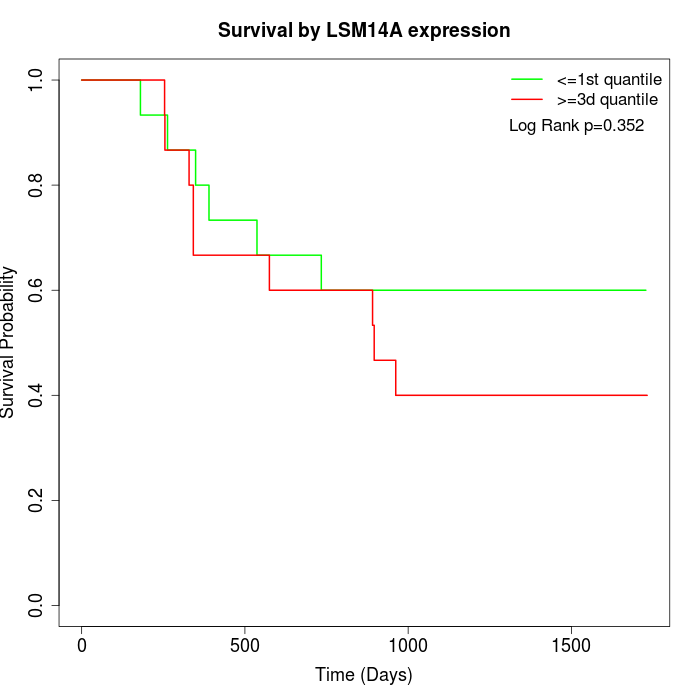 | 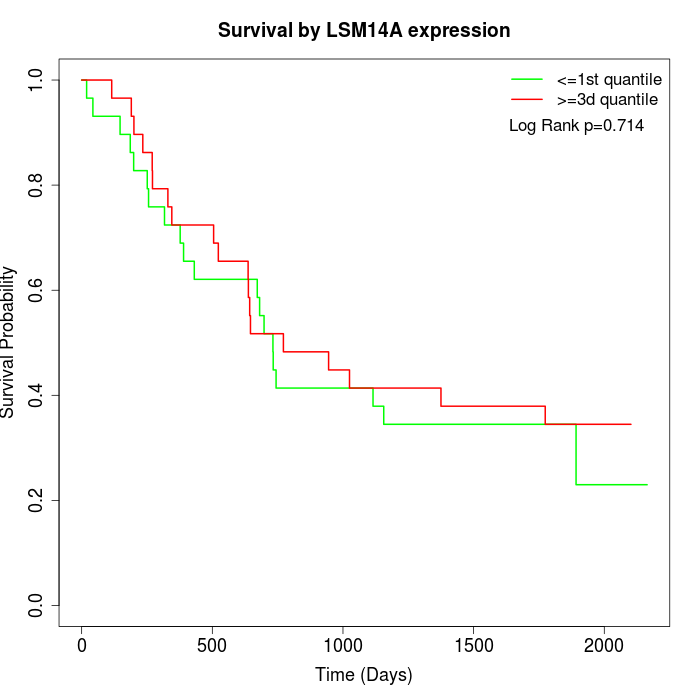 | 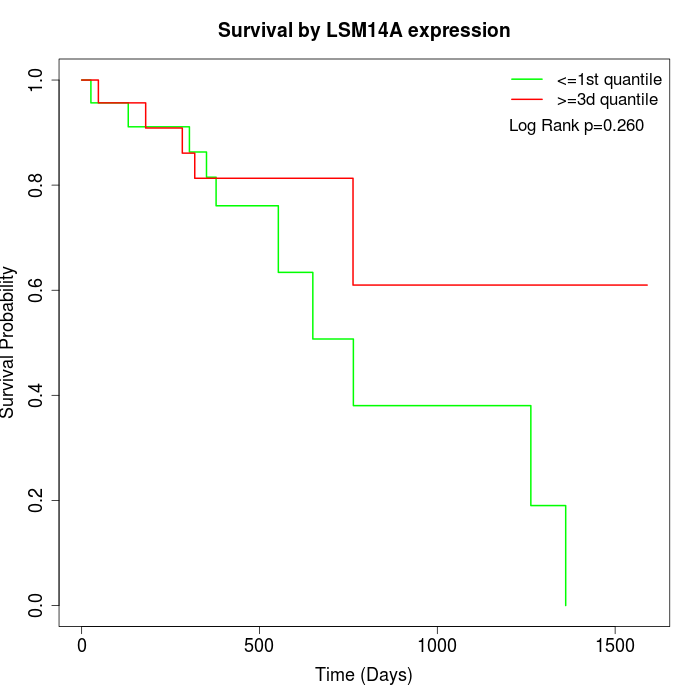 |
| GSE53622 | GSE53624 | TCGA |
Note: Click image to view full size file.
Copy number change of LSM14A:
| Dataset | Gene | EntrezID | Gain | Loss | Normal | Detail |
|---|---|---|---|---|---|---|
| GSE15526 | LSM14A | 26065 | 6 | 5 | 19 | |
| GSE20123 | LSM14A | 26065 | 6 | 4 | 20 | |
| GSE43470 | LSM14A | 26065 | 5 | 7 | 31 | |
| GSE46452 | LSM14A | 26065 | 48 | 1 | 10 | |
| GSE47630 | LSM14A | 26065 | 8 | 6 | 26 | |
| GSE54993 | LSM14A | 26065 | 17 | 3 | 50 | |
| GSE54994 | LSM14A | 26065 | 9 | 9 | 35 | |
| GSE60625 | LSM14A | 26065 | 9 | 0 | 2 | |
| GSE74703 | LSM14A | 26065 | 5 | 4 | 27 | |
| GSE74704 | LSM14A | 26065 | 6 | 2 | 12 | |
| TCGA | LSM14A | 26065 | 18 | 12 | 66 |
Total number of gains: 137; Total number of losses: 53; Total Number of normals: 298.
Somatic mutations of LSM14A:
Generating mutation plots.
Highly correlated genes for LSM14A:
Showing top 20/291 corelated genes with mean PCC>0.5.
| Gene1 | Gene2 | Mean PCC | Num. Datasets | Num. PCC<0 | Num. PCC>0.5 |
|---|---|---|---|---|---|
| LSM14A | SCAF4 | 0.802338 | 3 | 0 | 3 |
| LSM14A | R3HDM2 | 0.785651 | 3 | 0 | 3 |
| LSM14A | ZNF784 | 0.780278 | 3 | 0 | 3 |
| LSM14A | CYHR1 | 0.77611 | 3 | 0 | 3 |
| LSM14A | FBXL14 | 0.76949 | 3 | 0 | 3 |
| LSM14A | ZNF256 | 0.767384 | 3 | 0 | 3 |
| LSM14A | ZFAND5 | 0.762747 | 3 | 0 | 3 |
| LSM14A | AZIN1 | 0.755732 | 3 | 0 | 3 |
| LSM14A | TMEM143 | 0.75267 | 3 | 0 | 3 |
| LSM14A | ZNF740 | 0.74961 | 3 | 0 | 3 |
| LSM14A | ARFGAP2 | 0.747423 | 3 | 0 | 3 |
| LSM14A | WDR37 | 0.747133 | 3 | 0 | 3 |
| LSM14A | ZFP3 | 0.746895 | 3 | 0 | 3 |
| LSM14A | CNST | 0.742023 | 3 | 0 | 3 |
| LSM14A | RNF146 | 0.741757 | 3 | 0 | 3 |
| LSM14A | ANKRD40 | 0.737769 | 3 | 0 | 3 |
| LSM14A | DTNBP1 | 0.730915 | 3 | 0 | 3 |
| LSM14A | FAM122C | 0.729274 | 3 | 0 | 3 |
| LSM14A | NUB1 | 0.72502 | 3 | 0 | 3 |
| LSM14A | DOCK8 | 0.722955 | 3 | 0 | 3 |
For details and further investigation, click here