| Full name: F-box and leucine rich repeat protein 5 | Alias Symbol: FBL4|FBL5|FLR1 | ||
| Type: protein-coding gene | Cytoband: 4p15.32 | ||
| Entrez ID: 26234 | HGNC ID: HGNC:13602 | Ensembl Gene: ENSG00000118564 | OMIM ID: 605655 |
Screen Evidence:
| |||
Expression of FBXL5:
| Dataset | Gene | EntrezID | Probe | Log2FC | Adj.pValue | Expression |
|---|---|---|---|---|---|---|
| GSE17351 | FBXL5 | 26234 | 209004_s_at | -0.7200 | 0.0102 | |
| GSE20347 | FBXL5 | 26234 | 209004_s_at | -1.0945 | 0.0000 | |
| GSE23400 | FBXL5 | 26234 | 209004_s_at | -0.4696 | 0.0000 | |
| GSE26886 | FBXL5 | 26234 | 209004_s_at | -1.3372 | 0.0000 | |
| GSE29001 | FBXL5 | 26234 | 209004_s_at | -0.5982 | 0.0541 | |
| GSE38129 | FBXL5 | 26234 | 209004_s_at | -0.9755 | 0.0000 | |
| GSE45670 | FBXL5 | 26234 | 209004_s_at | -0.8056 | 0.0000 | |
| GSE53622 | FBXL5 | 26234 | 18520 | -0.4454 | 0.0000 | |
| GSE53624 | FBXL5 | 26234 | 18520 | -0.6592 | 0.0000 | |
| GSE63941 | FBXL5 | 26234 | 209004_s_at | -0.7526 | 0.1151 | |
| GSE77861 | FBXL5 | 26234 | 209004_s_at | -1.1101 | 0.0006 | |
| GSE97050 | FBXL5 | 26234 | A_23_P213247 | -0.1060 | 0.6589 | |
| SRP007169 | FBXL5 | 26234 | RNAseq | -0.9784 | 0.0351 | |
| SRP008496 | FBXL5 | 26234 | RNAseq | -0.6802 | 0.0047 | |
| SRP064894 | FBXL5 | 26234 | RNAseq | -0.4390 | 0.0253 | |
| SRP133303 | FBXL5 | 26234 | RNAseq | -0.4155 | 0.0146 | |
| SRP159526 | FBXL5 | 26234 | RNAseq | -0.8867 | 0.0000 | |
| SRP193095 | FBXL5 | 26234 | RNAseq | -0.7872 | 0.0000 | |
| SRP219564 | FBXL5 | 26234 | RNAseq | -0.8492 | 0.0116 | |
| TCGA | FBXL5 | 26234 | RNAseq | -0.2374 | 0.0000 |
Upregulated datasets: 0; Downregulated datasets: 3.
Survival by FBXL5 expression:
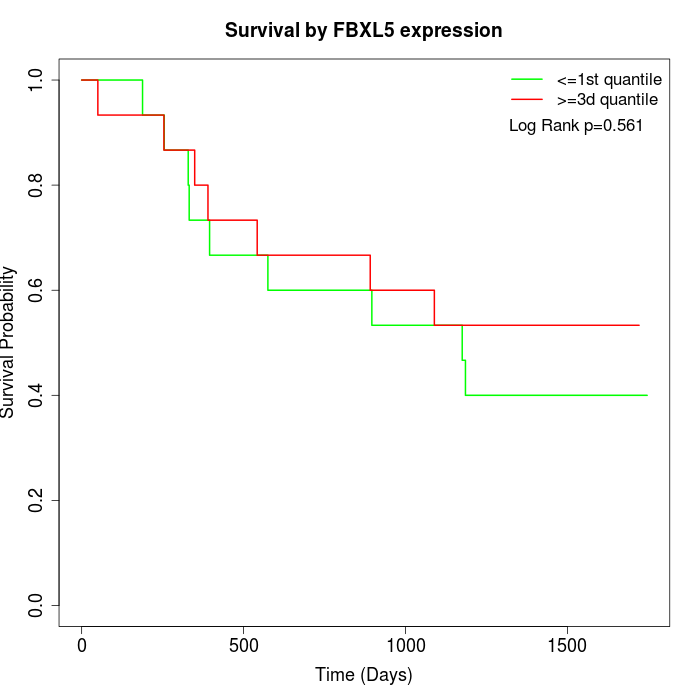 | 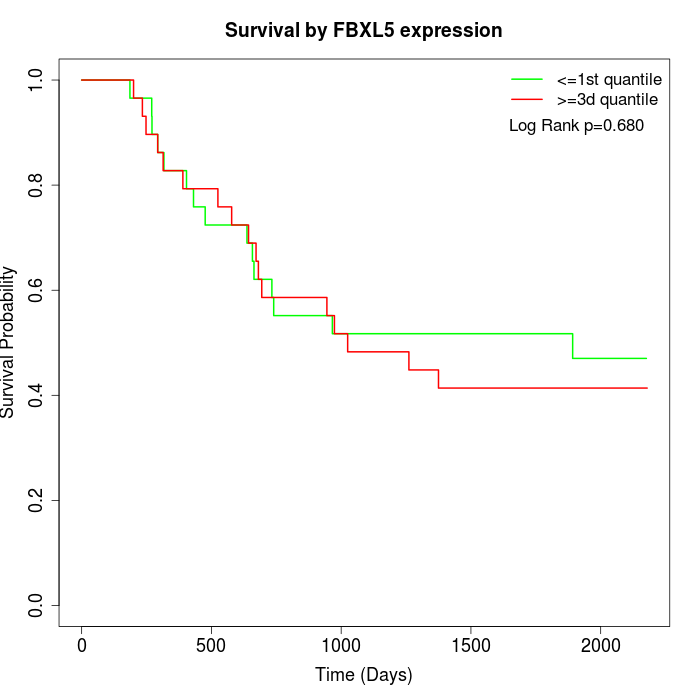 | 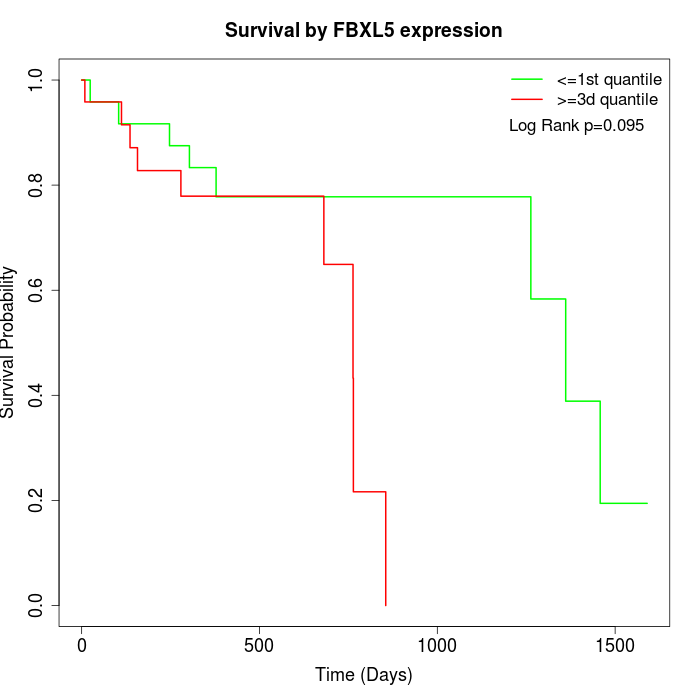 |
| GSE53622 | GSE53624 | TCGA |
Note: Click image to view full size file.
Copy number change of FBXL5:
| Dataset | Gene | EntrezID | Gain | Loss | Normal | Detail |
|---|---|---|---|---|---|---|
| GSE15526 | FBXL5 | 26234 | 0 | 18 | 12 | |
| GSE20123 | FBXL5 | 26234 | 0 | 18 | 12 | |
| GSE43470 | FBXL5 | 26234 | 1 | 15 | 27 | |
| GSE46452 | FBXL5 | 26234 | 1 | 36 | 22 | |
| GSE47630 | FBXL5 | 26234 | 1 | 19 | 20 | |
| GSE54993 | FBXL5 | 26234 | 10 | 0 | 60 | |
| GSE54994 | FBXL5 | 26234 | 4 | 12 | 37 | |
| GSE60625 | FBXL5 | 26234 | 0 | 0 | 11 | |
| GSE74703 | FBXL5 | 26234 | 1 | 13 | 22 | |
| GSE74704 | FBXL5 | 26234 | 0 | 11 | 9 | |
| TCGA | FBXL5 | 26234 | 9 | 48 | 39 |
Total number of gains: 27; Total number of losses: 190; Total Number of normals: 271.
Somatic mutations of FBXL5:
Generating mutation plots.
Highly correlated genes for FBXL5:
Showing top 20/1735 corelated genes with mean PCC>0.5.
| Gene1 | Gene2 | Mean PCC | Num. Datasets | Num. PCC<0 | Num. PCC>0.5 |
|---|---|---|---|---|---|
| FBXL5 | PSMD8 | 0.82309 | 3 | 0 | 3 |
| FBXL5 | TBC1D22B | 0.785581 | 3 | 0 | 3 |
| FBXL5 | AQR | 0.783209 | 3 | 0 | 3 |
| FBXL5 | SMDT1 | 0.775035 | 4 | 0 | 4 |
| FBXL5 | SNORA68 | 0.774021 | 4 | 0 | 4 |
| FBXL5 | YTHDF2 | 0.770461 | 3 | 0 | 3 |
| FBXL5 | CAB39L | 0.768924 | 9 | 0 | 9 |
| FBXL5 | P4HB | 0.763088 | 3 | 0 | 3 |
| FBXL5 | FCHO2 | 0.759231 | 7 | 0 | 7 |
| FBXL5 | SNX17 | 0.758993 | 3 | 0 | 3 |
| FBXL5 | SFTA2 | 0.745704 | 4 | 0 | 4 |
| FBXL5 | BBIP1 | 0.741296 | 7 | 0 | 7 |
| FBXL5 | TCAIM | 0.738376 | 5 | 0 | 5 |
| FBXL5 | EIF4E3 | 0.738228 | 8 | 0 | 7 |
| FBXL5 | KDM5D | 0.730987 | 3 | 0 | 3 |
| FBXL5 | DLG2 | 0.72781 | 10 | 0 | 9 |
| FBXL5 | BRWD3 | 0.727084 | 3 | 0 | 3 |
| FBXL5 | RBM20 | 0.726575 | 5 | 0 | 5 |
| FBXL5 | KIAA0232 | 0.726454 | 11 | 0 | 10 |
| FBXL5 | SHROOM3 | 0.723795 | 7 | 0 | 7 |
For details and further investigation, click here