| Full name: single-pass membrane protein with aspartate rich tail 1 | Alias Symbol: dJ186O1.1|DDDD|EMRE | ||
| Type: protein-coding gene | Cytoband: 22q13.2 | ||
| Entrez ID: 91689 | HGNC ID: HGNC:25055 | Ensembl Gene: ENSG00000183172 | OMIM ID: 615588 |
Expression of SMDT1:
| Dataset | Gene | EntrezID | Probe | Log2FC | Adj.pValue | Expression |
|---|---|---|---|---|---|---|
| GSE17351 | SMDT1 | 91689 | 225794_s_at | -1.0465 | 0.0088 | |
| GSE26886 | SMDT1 | 91689 | 225794_s_at | -0.4803 | 0.0070 | |
| GSE45670 | SMDT1 | 91689 | 225794_s_at | -0.7777 | 0.0002 | |
| GSE53622 | SMDT1 | 91689 | 32252 | -0.0916 | 0.3918 | |
| GSE53624 | SMDT1 | 91689 | 32252 | -0.3206 | 0.0041 | |
| GSE63941 | SMDT1 | 91689 | 225794_s_at | 0.0938 | 0.8711 | |
| GSE77861 | SMDT1 | 91689 | 225794_s_at | -0.9912 | 0.0005 | |
| SRP007169 | SMDT1 | 91689 | RNAseq | -1.7959 | 0.0000 | |
| SRP008496 | SMDT1 | 91689 | RNAseq | -1.8191 | 0.0000 | |
| SRP064894 | SMDT1 | 91689 | RNAseq | -0.7373 | 0.0363 | |
| SRP133303 | SMDT1 | 91689 | RNAseq | -1.0487 | 0.0000 | |
| SRP159526 | SMDT1 | 91689 | RNAseq | -0.8572 | 0.0000 | |
| SRP193095 | SMDT1 | 91689 | RNAseq | -1.2572 | 0.0000 | |
| SRP219564 | SMDT1 | 91689 | RNAseq | -1.1565 | 0.0000 |
Upregulated datasets: 0; Downregulated datasets: 6.
Survival by SMDT1 expression:
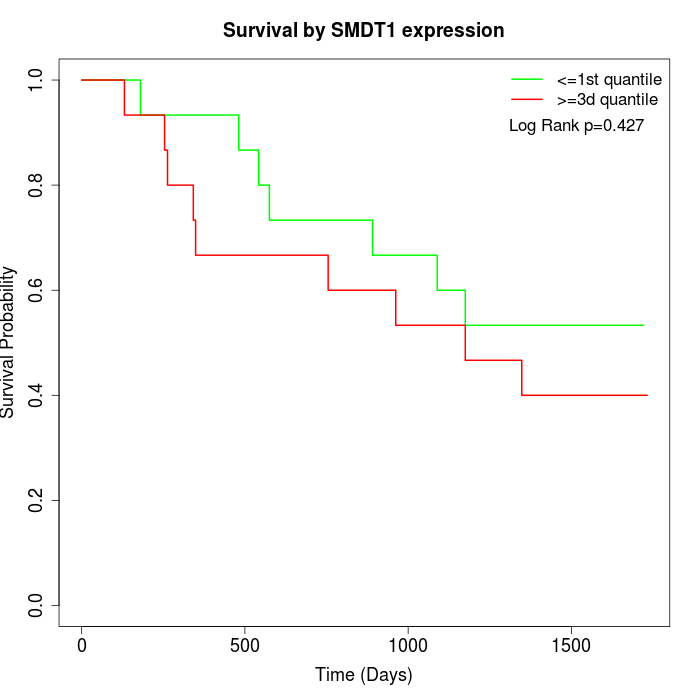 | 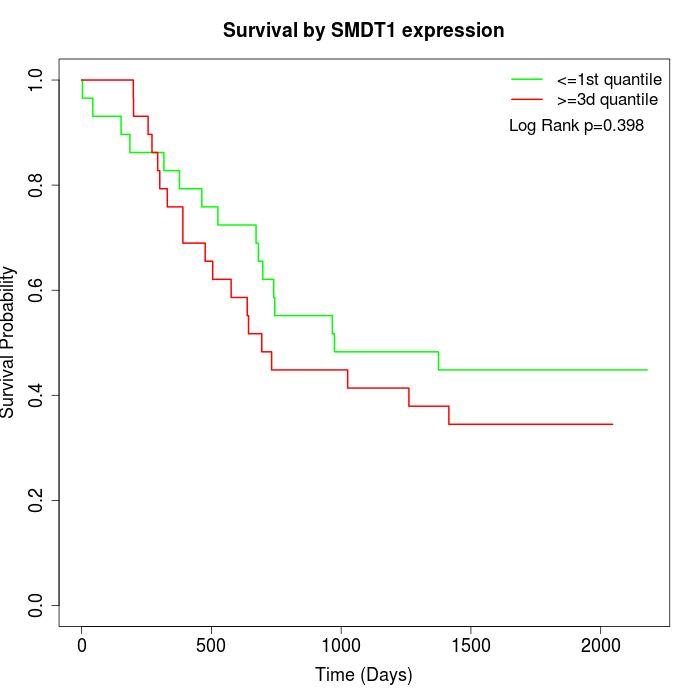 |
| GSE53622 | GSE53624 |
Note: Click image to view full size file.
Copy number change of SMDT1:
| Dataset | Gene | EntrezID | Gain | Loss | Normal | Detail |
|---|---|---|---|---|---|---|
| GSE15526 | SMDT1 | 91689 | 6 | 5 | 19 | |
| GSE20123 | SMDT1 | 91689 | 6 | 4 | 20 | |
| GSE43470 | SMDT1 | 91689 | 5 | 6 | 32 | |
| GSE46452 | SMDT1 | 91689 | 31 | 2 | 26 | |
| GSE47630 | SMDT1 | 91689 | 9 | 4 | 27 | |
| GSE54993 | SMDT1 | 91689 | 3 | 6 | 61 | |
| GSE54994 | SMDT1 | 91689 | 11 | 8 | 34 | |
| GSE60625 | SMDT1 | 91689 | 5 | 0 | 6 | |
| GSE74703 | SMDT1 | 91689 | 5 | 4 | 27 | |
| GSE74704 | SMDT1 | 91689 | 3 | 2 | 15 | |
| TCGA | SMDT1 | 91689 | 28 | 13 | 55 |
Total number of gains: 112; Total number of losses: 54; Total Number of normals: 322.
Somatic mutations of SMDT1:
Generating mutation plots.
Highly correlated genes for SMDT1:
Showing top 20/890 corelated genes with mean PCC>0.5.
| Gene1 | Gene2 | Mean PCC | Num. Datasets | Num. PCC<0 | Num. PCC>0.5 |
|---|---|---|---|---|---|
| SMDT1 | MPC1 | 0.812915 | 4 | 0 | 4 |
| SMDT1 | TFAP2B | 0.79788 | 4 | 0 | 4 |
| SMDT1 | KCTD6 | 0.795133 | 3 | 0 | 3 |
| SMDT1 | TOB1 | 0.795123 | 3 | 0 | 3 |
| SMDT1 | ALDH9A1 | 0.793172 | 4 | 0 | 4 |
| SMDT1 | SLC16A6 | 0.792607 | 4 | 0 | 4 |
| SMDT1 | CTTNBP2 | 0.790155 | 4 | 0 | 4 |
| SMDT1 | HS3ST6 | 0.785956 | 3 | 0 | 3 |
| SMDT1 | ETFDH | 0.784935 | 4 | 0 | 4 |
| SMDT1 | PTN | 0.784172 | 4 | 0 | 3 |
| SMDT1 | GAB2 | 0.782738 | 4 | 0 | 4 |
| SMDT1 | SNORA68 | 0.782659 | 4 | 0 | 4 |
| SMDT1 | LRBA | 0.782403 | 3 | 0 | 3 |
| SMDT1 | PHYHIP | 0.780403 | 3 | 0 | 3 |
| SMDT1 | FBXL5 | 0.775035 | 4 | 0 | 4 |
| SMDT1 | UBL3 | 0.774037 | 4 | 0 | 4 |
| SMDT1 | EPHX2 | 0.77327 | 4 | 0 | 4 |
| SMDT1 | KIAA0232 | 0.773177 | 4 | 0 | 4 |
| SMDT1 | ZFAND2B | 0.769848 | 4 | 0 | 4 |
| SMDT1 | ANXA11 | 0.76822 | 3 | 0 | 3 |
For details and further investigation, click here