| Full name: F-box protein 40 | Alias Symbol: KIAA1195|Fbx40 | ||
| Type: protein-coding gene | Cytoband: 3q13.33 | ||
| Entrez ID: 51725 | HGNC ID: HGNC:29816 | Ensembl Gene: ENSG00000163833 | OMIM ID: 609107 |
Expression of FBXO40:
| Dataset | Gene | EntrezID | Probe | Log2FC | Adj.pValue | Expression |
|---|---|---|---|---|---|---|
| GSE17351 | FBXO40 | 51725 | 220164_s_at | 0.0174 | 0.9592 | |
| GSE20347 | FBXO40 | 51725 | 220164_s_at | 0.1535 | 0.0298 | |
| GSE23400 | FBXO40 | 51725 | 220164_s_at | -0.0770 | 0.0323 | |
| GSE26886 | FBXO40 | 51725 | 220164_s_at | -0.0063 | 0.9582 | |
| GSE29001 | FBXO40 | 51725 | 220164_s_at | 0.0365 | 0.8362 | |
| GSE38129 | FBXO40 | 51725 | 220164_s_at | -0.0110 | 0.9003 | |
| GSE45670 | FBXO40 | 51725 | 222954_at | 0.0362 | 0.6654 | |
| GSE53622 | FBXO40 | 51725 | 67641 | -0.7186 | 0.0000 | |
| GSE53624 | FBXO40 | 51725 | 67641 | -1.0195 | 0.0000 | |
| GSE63941 | FBXO40 | 51725 | 220164_s_at | 0.1650 | 0.4201 | |
| GSE77861 | FBXO40 | 51725 | 220164_s_at | -0.0836 | 0.3470 | |
| SRP133303 | FBXO40 | 51725 | RNAseq | -0.2394 | 0.2093 | |
| SRP193095 | FBXO40 | 51725 | RNAseq | -0.1459 | 0.3172 | |
| TCGA | FBXO40 | 51725 | RNAseq | -0.6319 | 0.6004 |
Upregulated datasets: 0; Downregulated datasets: 1.
Survival by FBXO40 expression:
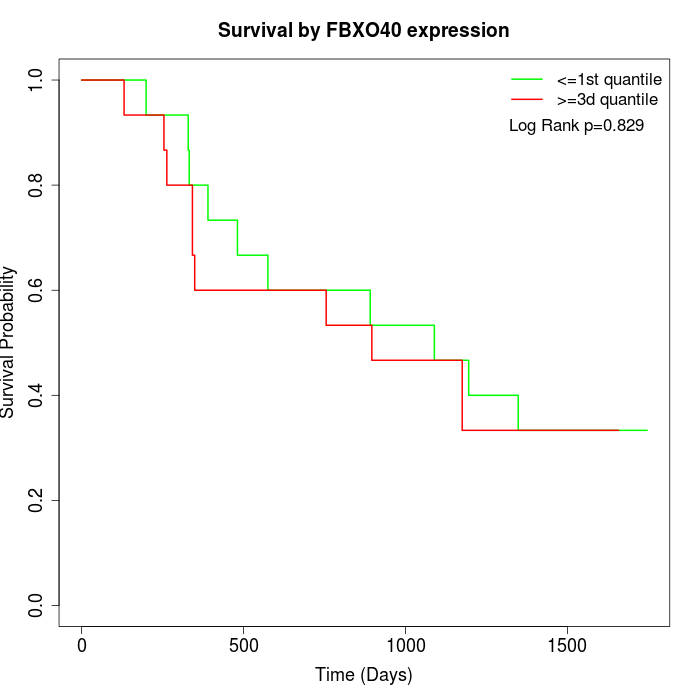 | 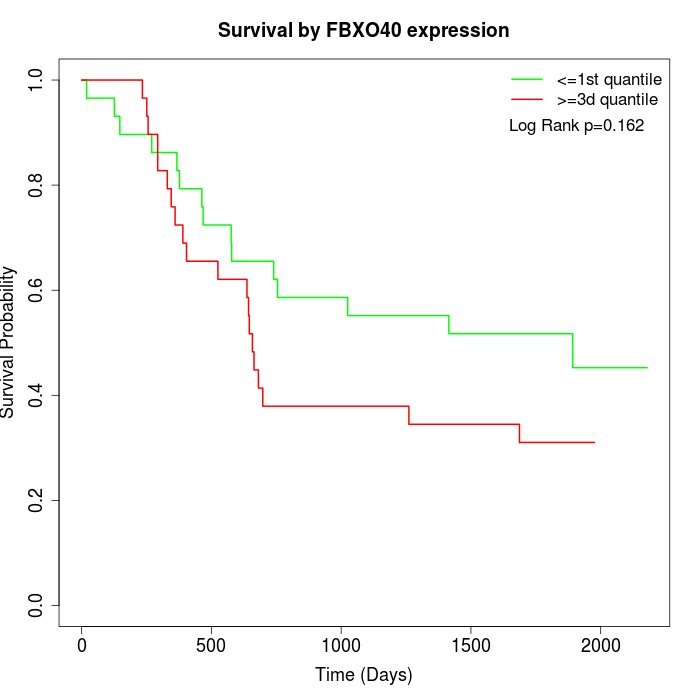 | 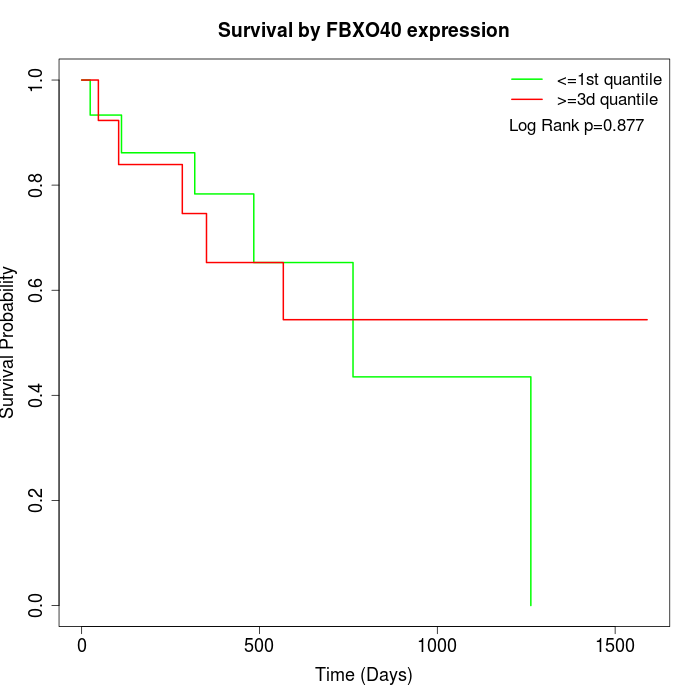 |
| GSE53622 | GSE53624 | TCGA |
Note: Click image to view full size file.
Copy number change of FBXO40:
| Dataset | Gene | EntrezID | Gain | Loss | Normal | Detail |
|---|---|---|---|---|---|---|
| GSE15526 | FBXO40 | 51725 | 18 | 0 | 12 | |
| GSE20123 | FBXO40 | 51725 | 18 | 0 | 12 | |
| GSE43470 | FBXO40 | 51725 | 20 | 0 | 23 | |
| GSE46452 | FBXO40 | 51725 | 14 | 5 | 40 | |
| GSE47630 | FBXO40 | 51725 | 16 | 5 | 19 | |
| GSE54993 | FBXO40 | 51725 | 2 | 6 | 62 | |
| GSE54994 | FBXO40 | 51725 | 30 | 4 | 19 | |
| GSE60625 | FBXO40 | 51725 | 0 | 6 | 5 | |
| GSE74703 | FBXO40 | 51725 | 16 | 0 | 20 | |
| GSE74704 | FBXO40 | 51725 | 13 | 0 | 7 | |
| TCGA | FBXO40 | 51725 | 54 | 6 | 36 |
Total number of gains: 201; Total number of losses: 32; Total Number of normals: 255.
Somatic mutations of FBXO40:
Generating mutation plots.
Highly correlated genes for FBXO40:
Showing top 20/404 corelated genes with mean PCC>0.5.
| Gene1 | Gene2 | Mean PCC | Num. Datasets | Num. PCC<0 | Num. PCC>0.5 |
|---|---|---|---|---|---|
| FBXO40 | MYT1L | 0.70937 | 3 | 0 | 3 |
| FBXO40 | ZPBP | 0.641495 | 4 | 0 | 4 |
| FBXO40 | ARMC4 | 0.635926 | 3 | 0 | 3 |
| FBXO40 | OR6A2 | 0.635276 | 4 | 0 | 3 |
| FBXO40 | C20orf203 | 0.633823 | 4 | 0 | 4 |
| FBXO40 | SYN1 | 0.632324 | 6 | 0 | 6 |
| FBXO40 | HAO1 | 0.631302 | 5 | 0 | 4 |
| FBXO40 | SNAP91 | 0.631021 | 4 | 0 | 3 |
| FBXO40 | OR1F1 | 0.630162 | 5 | 0 | 5 |
| FBXO40 | RHAG | 0.626617 | 4 | 0 | 3 |
| FBXO40 | NPHP1 | 0.626582 | 4 | 0 | 4 |
| FBXO40 | COL4A3 | 0.626482 | 4 | 0 | 3 |
| FBXO40 | GALR1 | 0.626049 | 4 | 0 | 3 |
| FBXO40 | LEFTY1 | 0.625413 | 5 | 0 | 4 |
| FBXO40 | DRD5 | 0.625016 | 3 | 0 | 3 |
| FBXO40 | NOX1 | 0.622856 | 4 | 0 | 4 |
| FBXO40 | SLC7A10 | 0.62067 | 4 | 0 | 4 |
| FBXO40 | HTR1E | 0.618651 | 6 | 0 | 5 |
| FBXO40 | LILRA4 | 0.618535 | 5 | 0 | 5 |
| FBXO40 | IL5RA | 0.618429 | 4 | 0 | 3 |
For details and further investigation, click here