| Full name: formin binding protein 1 | Alias Symbol: FBP17|KIAA0554 | ||
| Type: protein-coding gene | Cytoband: 9q34.11 | ||
| Entrez ID: 23048 | HGNC ID: HGNC:17069 | Ensembl Gene: ENSG00000187239 | OMIM ID: 606191 |
Expression of FNBP1:
| Dataset | Gene | EntrezID | Probe | Log2FC | Adj.pValue | Expression |
|---|---|---|---|---|---|---|
| GSE17351 | FNBP1 | 23048 | 212288_at | -1.3678 | 0.1236 | |
| GSE20347 | FNBP1 | 23048 | 213940_s_at | -0.2397 | 0.1119 | |
| GSE23400 | FNBP1 | 23048 | 212288_at | -0.8209 | 0.0000 | |
| GSE26886 | FNBP1 | 23048 | 212288_at | -0.9460 | 0.0027 | |
| GSE29001 | FNBP1 | 23048 | 212288_at | -0.8465 | 0.0135 | |
| GSE38129 | FNBP1 | 23048 | 212288_at | -1.3288 | 0.0001 | |
| GSE45670 | FNBP1 | 23048 | 212288_at | -1.2718 | 0.0000 | |
| GSE53622 | FNBP1 | 23048 | 3852 | -0.3613 | 0.0000 | |
| GSE53624 | FNBP1 | 23048 | 3852 | -0.3089 | 0.0000 | |
| GSE63941 | FNBP1 | 23048 | 212288_at | -1.4580 | 0.0004 | |
| GSE77861 | FNBP1 | 23048 | 212288_at | -0.3143 | 0.1505 | |
| GSE97050 | FNBP1 | 23048 | A_33_P3367565 | -0.4715 | 0.1703 | |
| SRP007169 | FNBP1 | 23048 | RNAseq | -0.1863 | 0.6020 | |
| SRP008496 | FNBP1 | 23048 | RNAseq | -0.0059 | 0.9822 | |
| SRP064894 | FNBP1 | 23048 | RNAseq | -0.6960 | 0.0038 | |
| SRP133303 | FNBP1 | 23048 | RNAseq | -0.5743 | 0.0329 | |
| SRP159526 | FNBP1 | 23048 | RNAseq | -0.7218 | 0.0020 | |
| SRP193095 | FNBP1 | 23048 | RNAseq | -0.1649 | 0.3310 | |
| SRP219564 | FNBP1 | 23048 | RNAseq | -0.7163 | 0.3379 | |
| TCGA | FNBP1 | 23048 | RNAseq | -0.3109 | 0.0001 |
Upregulated datasets: 0; Downregulated datasets: 3.
Survival by FNBP1 expression:
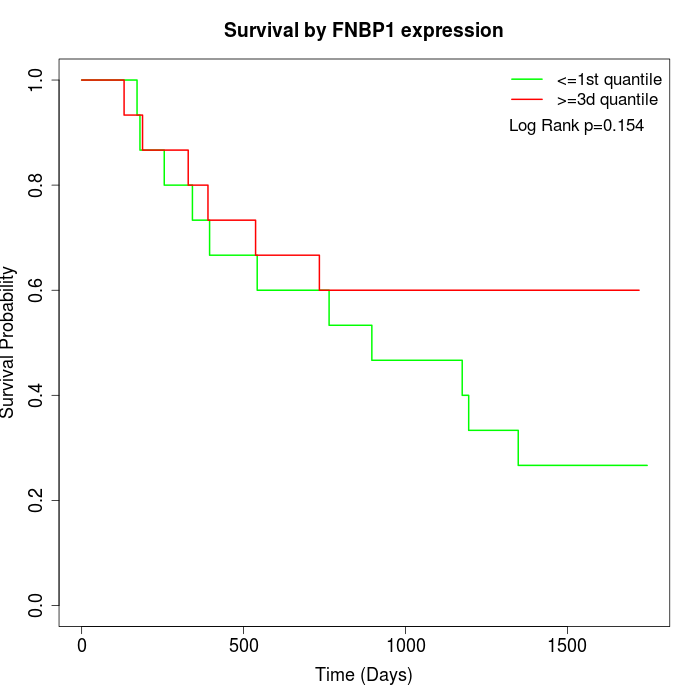 | 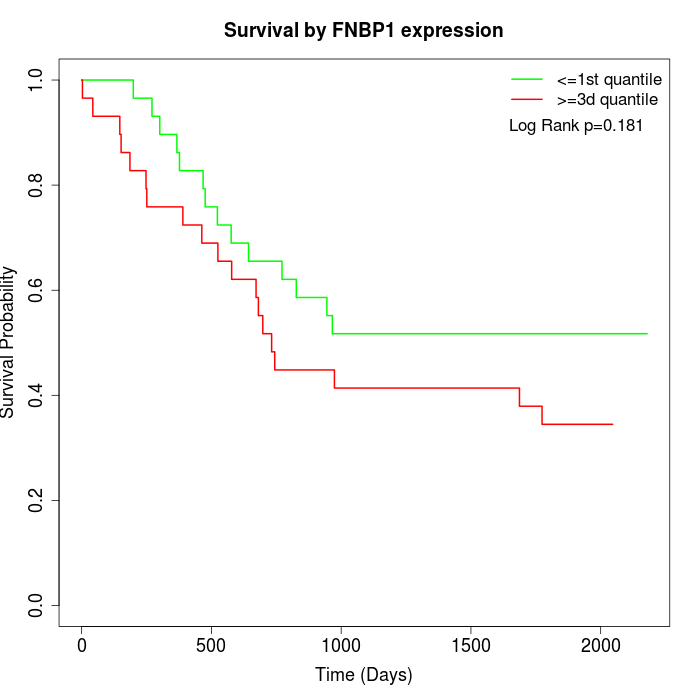 | 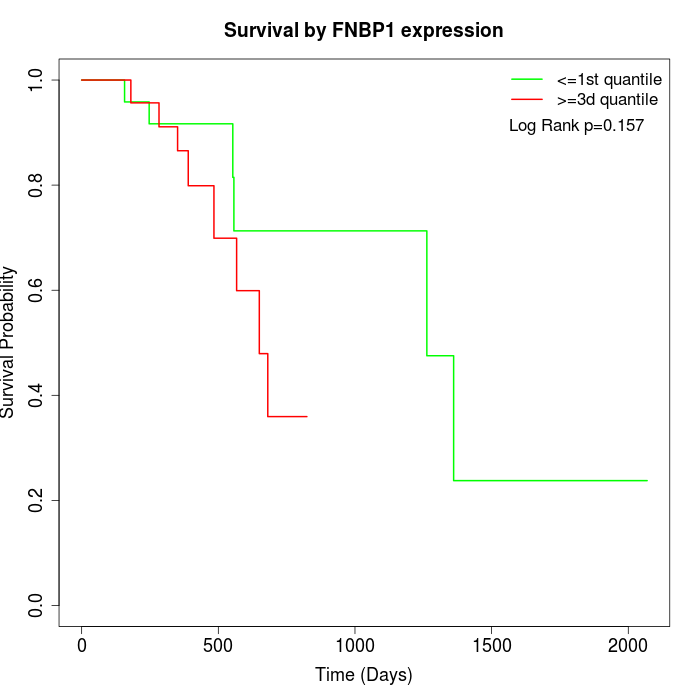 |
| GSE53622 | GSE53624 | TCGA |
Note: Click image to view full size file.
Copy number change of FNBP1:
| Dataset | Gene | EntrezID | Gain | Loss | Normal | Detail |
|---|---|---|---|---|---|---|
| GSE15526 | FNBP1 | 23048 | 6 | 9 | 15 | |
| GSE20123 | FNBP1 | 23048 | 6 | 9 | 15 | |
| GSE43470 | FNBP1 | 23048 | 5 | 7 | 31 | |
| GSE46452 | FNBP1 | 23048 | 6 | 13 | 40 | |
| GSE47630 | FNBP1 | 23048 | 3 | 16 | 21 | |
| GSE54993 | FNBP1 | 23048 | 3 | 3 | 64 | |
| GSE54994 | FNBP1 | 23048 | 12 | 9 | 32 | |
| GSE60625 | FNBP1 | 23048 | 0 | 0 | 11 | |
| GSE74703 | FNBP1 | 23048 | 5 | 5 | 26 | |
| GSE74704 | FNBP1 | 23048 | 3 | 7 | 10 | |
| TCGA | FNBP1 | 23048 | 27 | 26 | 43 |
Total number of gains: 76; Total number of losses: 104; Total Number of normals: 308.
Somatic mutations of FNBP1:
Generating mutation plots.
Highly correlated genes for FNBP1:
Showing top 20/1357 corelated genes with mean PCC>0.5.
| Gene1 | Gene2 | Mean PCC | Num. Datasets | Num. PCC<0 | Num. PCC>0.5 |
|---|---|---|---|---|---|
| FNBP1 | PREX2 | 0.816418 | 3 | 0 | 3 |
| FNBP1 | CYP4V2 | 0.808399 | 4 | 0 | 4 |
| FNBP1 | MCFD2 | 0.796087 | 3 | 0 | 3 |
| FNBP1 | TMEM132C | 0.787453 | 3 | 0 | 3 |
| FNBP1 | ZCCHC24 | 0.786755 | 7 | 0 | 7 |
| FNBP1 | C7 | 0.784564 | 8 | 0 | 8 |
| FNBP1 | LINC00938 | 0.782799 | 3 | 0 | 3 |
| FNBP1 | FLNC | 0.781018 | 8 | 0 | 8 |
| FNBP1 | PARVA | 0.772152 | 7 | 0 | 7 |
| FNBP1 | CNN1 | 0.771713 | 8 | 0 | 7 |
| FNBP1 | TBX5 | 0.77117 | 5 | 0 | 5 |
| FNBP1 | FAM13C | 0.770464 | 5 | 0 | 5 |
| FNBP1 | MRVI1 | 0.770217 | 6 | 0 | 6 |
| FNBP1 | FKBP7 | 0.769594 | 3 | 0 | 3 |
| FNBP1 | PRDM10 | 0.762927 | 3 | 0 | 3 |
| FNBP1 | SMTNL2 | 0.761822 | 4 | 0 | 4 |
| FNBP1 | KAT7 | 0.761529 | 4 | 0 | 3 |
| FNBP1 | RASL12 | 0.761075 | 9 | 0 | 8 |
| FNBP1 | PDE5A | 0.755708 | 9 | 0 | 8 |
| FNBP1 | GPRASP1 | 0.753721 | 9 | 0 | 9 |
For details and further investigation, click here