| Full name: formin binding protein 1 like | Alias Symbol: TOCA1|FLJ20275 | ||
| Type: protein-coding gene | Cytoband: 1p22.1 | ||
| Entrez ID: 54874 | HGNC ID: HGNC:20851 | Ensembl Gene: ENSG00000137942 | OMIM ID: 608848 |
Expression of FNBP1L:
| Dataset | Gene | EntrezID | Probe | Log2FC | Adj.pValue | Expression |
|---|---|---|---|---|---|---|
| GSE17351 | FNBP1L | 54874 | 215017_s_at | 0.4794 | 0.3188 | |
| GSE20347 | FNBP1L | 54874 | 215017_s_at | -0.1528 | 0.6148 | |
| GSE23400 | FNBP1L | 54874 | 215017_s_at | 0.2734 | 0.0019 | |
| GSE26886 | FNBP1L | 54874 | 215017_s_at | 0.2832 | 0.2840 | |
| GSE29001 | FNBP1L | 54874 | 215017_s_at | -0.1449 | 0.7301 | |
| GSE38129 | FNBP1L | 54874 | 215017_s_at | 0.0441 | 0.8465 | |
| GSE45670 | FNBP1L | 54874 | 215017_s_at | 0.0825 | 0.7389 | |
| GSE53622 | FNBP1L | 54874 | 57477 | 0.1400 | 0.2003 | |
| GSE53624 | FNBP1L | 54874 | 57477 | 0.0405 | 0.7437 | |
| GSE63941 | FNBP1L | 54874 | 215017_s_at | -0.1878 | 0.8041 | |
| GSE77861 | FNBP1L | 54874 | 215017_s_at | -0.3873 | 0.1500 | |
| GSE97050 | FNBP1L | 54874 | A_23_P417942 | 0.2497 | 0.3944 | |
| SRP007169 | FNBP1L | 54874 | RNAseq | -0.4659 | 0.3189 | |
| SRP008496 | FNBP1L | 54874 | RNAseq | -0.1285 | 0.7114 | |
| SRP064894 | FNBP1L | 54874 | RNAseq | 0.2456 | 0.2214 | |
| SRP133303 | FNBP1L | 54874 | RNAseq | 0.3662 | 0.0978 | |
| SRP159526 | FNBP1L | 54874 | RNAseq | -0.2395 | 0.4562 | |
| SRP193095 | FNBP1L | 54874 | RNAseq | -0.2118 | 0.2956 | |
| SRP219564 | FNBP1L | 54874 | RNAseq | 0.0622 | 0.8562 | |
| TCGA | FNBP1L | 54874 | RNAseq | -0.2665 | 0.0004 |
Upregulated datasets: 0; Downregulated datasets: 0.
Survival by FNBP1L expression:
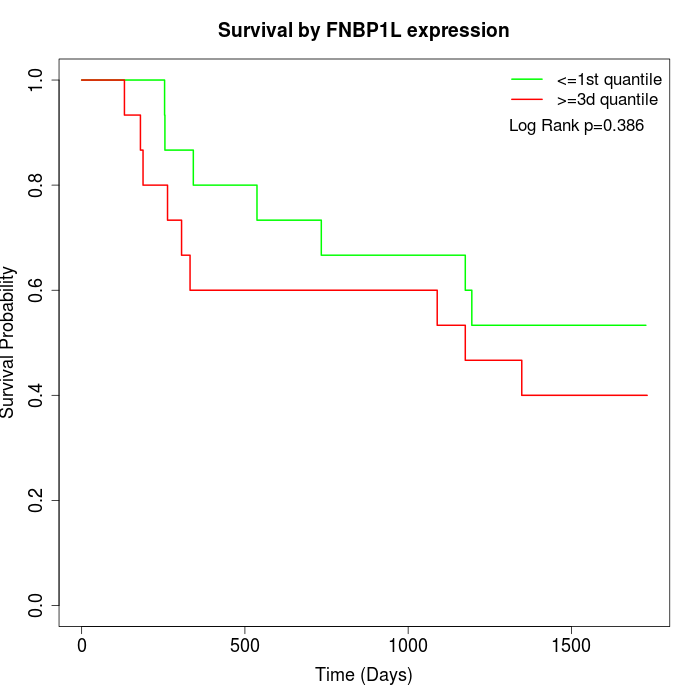 | 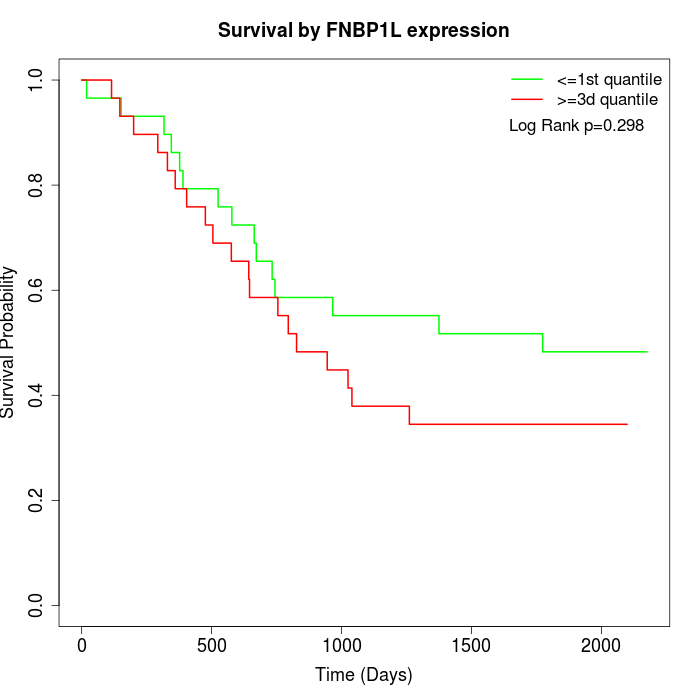 | 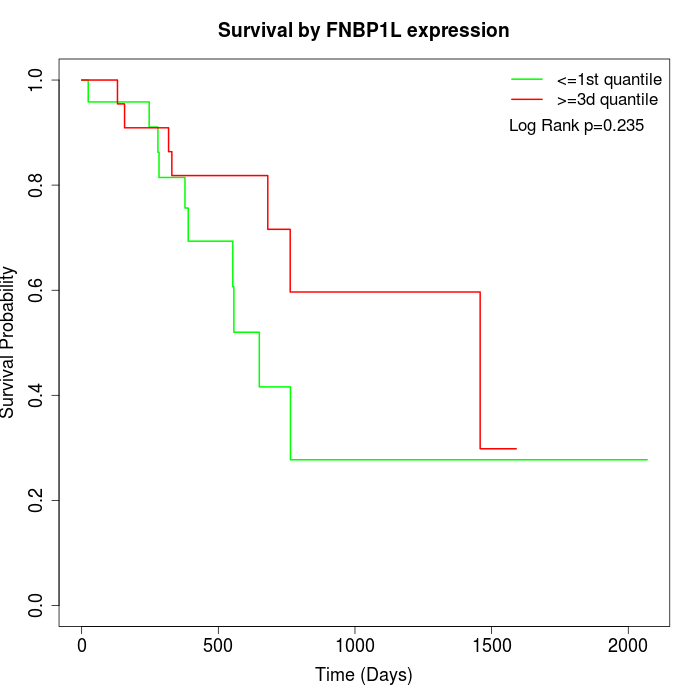 |
| GSE53622 | GSE53624 | TCGA |
Note: Click image to view full size file.
Copy number change of FNBP1L:
| Dataset | Gene | EntrezID | Gain | Loss | Normal | Detail |
|---|---|---|---|---|---|---|
| GSE15526 | FNBP1L | 54874 | 0 | 8 | 22 | |
| GSE20123 | FNBP1L | 54874 | 0 | 8 | 22 | |
| GSE43470 | FNBP1L | 54874 | 2 | 6 | 35 | |
| GSE46452 | FNBP1L | 54874 | 1 | 1 | 57 | |
| GSE47630 | FNBP1L | 54874 | 8 | 5 | 27 | |
| GSE54993 | FNBP1L | 54874 | 0 | 1 | 69 | |
| GSE54994 | FNBP1L | 54874 | 6 | 3 | 44 | |
| GSE60625 | FNBP1L | 54874 | 0 | 0 | 11 | |
| GSE74703 | FNBP1L | 54874 | 1 | 5 | 30 | |
| GSE74704 | FNBP1L | 54874 | 0 | 5 | 15 | |
| TCGA | FNBP1L | 54874 | 6 | 24 | 66 |
Total number of gains: 24; Total number of losses: 66; Total Number of normals: 398.
Somatic mutations of FNBP1L:
Generating mutation plots.
Highly correlated genes for FNBP1L:
Showing top 20/228 corelated genes with mean PCC>0.5.
| Gene1 | Gene2 | Mean PCC | Num. Datasets | Num. PCC<0 | Num. PCC>0.5 |
|---|---|---|---|---|---|
| FNBP1L | LMLN | 0.823306 | 3 | 0 | 3 |
| FNBP1L | RCHY1 | 0.802976 | 3 | 0 | 3 |
| FNBP1L | NUDT19 | 0.772625 | 3 | 0 | 3 |
| FNBP1L | LSG1 | 0.764034 | 3 | 0 | 3 |
| FNBP1L | ZNF165 | 0.763714 | 3 | 0 | 3 |
| FNBP1L | ARHGAP39 | 0.745998 | 3 | 0 | 3 |
| FNBP1L | KLHL8 | 0.727948 | 3 | 0 | 3 |
| FNBP1L | ZNF623 | 0.724958 | 3 | 0 | 3 |
| FNBP1L | PDRG1 | 0.718405 | 3 | 0 | 3 |
| FNBP1L | SPIC | 0.713952 | 3 | 0 | 3 |
| FNBP1L | C3orf14 | 0.707591 | 3 | 0 | 3 |
| FNBP1L | ZBED4 | 0.703814 | 3 | 0 | 3 |
| FNBP1L | LRRC39 | 0.696354 | 4 | 0 | 4 |
| FNBP1L | TUBD1 | 0.696082 | 3 | 0 | 3 |
| FNBP1L | CSPP1 | 0.693625 | 4 | 0 | 3 |
| FNBP1L | RBM45 | 0.692888 | 3 | 0 | 3 |
| FNBP1L | ZNF121 | 0.690343 | 4 | 0 | 3 |
| FNBP1L | TUBGCP3 | 0.686883 | 3 | 0 | 3 |
| FNBP1L | HEATR3 | 0.686268 | 3 | 0 | 3 |
| FNBP1L | CCDC137 | 0.683845 | 3 | 0 | 3 |
For details and further investigation, click here