| Full name: fibronectin type III and SPRY domain containing 1 | Alias Symbol: MGC3213|MIR1 | ||
| Type: protein-coding gene | Cytoband: 19p13.3 | ||
| Entrez ID: 79187 | HGNC ID: HGNC:13745 | Ensembl Gene: ENSG00000105255 | OMIM ID: 609828 |
Expression of FSD1:
| Dataset | Gene | EntrezID | Probe | Log2FC | Adj.pValue | Expression |
|---|---|---|---|---|---|---|
| GSE17351 | FSD1 | 79187 | 219170_at | 0.0654 | 0.8705 | |
| GSE20347 | FSD1 | 79187 | 219170_at | 0.1424 | 0.3816 | |
| GSE23400 | FSD1 | 79187 | 219170_at | -0.0810 | 0.1397 | |
| GSE26886 | FSD1 | 79187 | 219170_at | -0.0407 | 0.8256 | |
| GSE29001 | FSD1 | 79187 | 219170_at | 0.2558 | 0.3165 | |
| GSE38129 | FSD1 | 79187 | 219170_at | 0.1943 | 0.0840 | |
| GSE45670 | FSD1 | 79187 | 219170_at | 0.3197 | 0.0083 | |
| GSE53622 | FSD1 | 79187 | 48657 | 0.1939 | 0.0013 | |
| GSE53624 | FSD1 | 79187 | 48657 | 0.1106 | 0.2489 | |
| GSE63941 | FSD1 | 79187 | 219170_at | 0.5475 | 0.3630 | |
| GSE77861 | FSD1 | 79187 | 219170_at | -0.1916 | 0.1444 | |
| GSE97050 | FSD1 | 79187 | A_33_P3414789 | 0.1776 | 0.4996 | |
| SRP219564 | FSD1 | 79187 | RNAseq | 0.9103 | 0.1583 | |
| TCGA | FSD1 | 79187 | RNAseq | 1.0946 | 0.0167 |
Upregulated datasets: 1; Downregulated datasets: 0.
Survival by FSD1 expression:
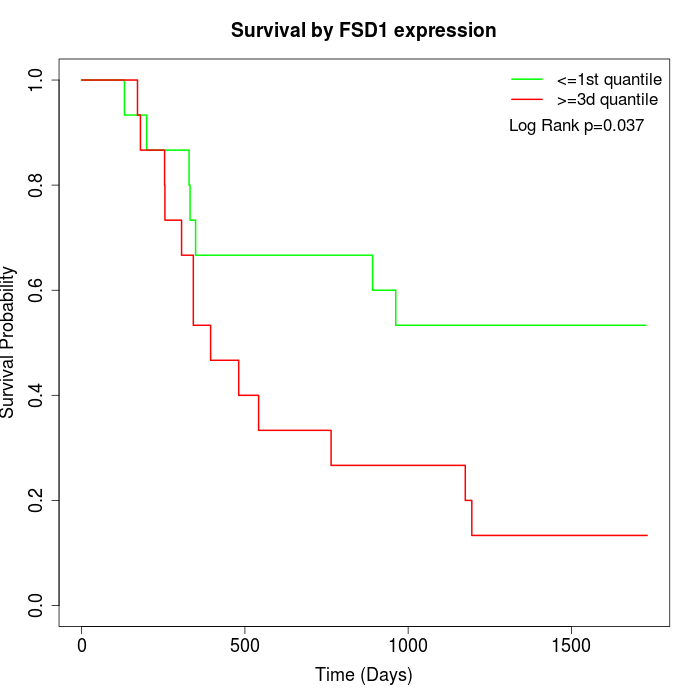 | 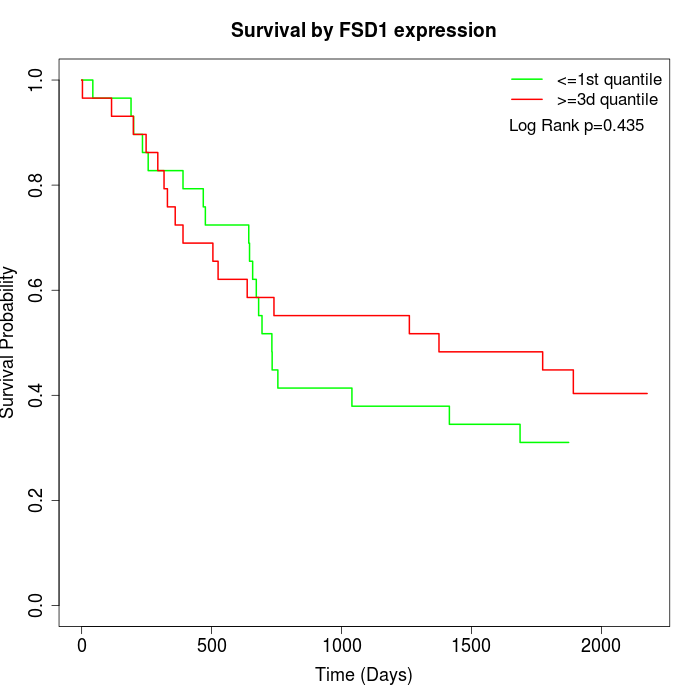 | 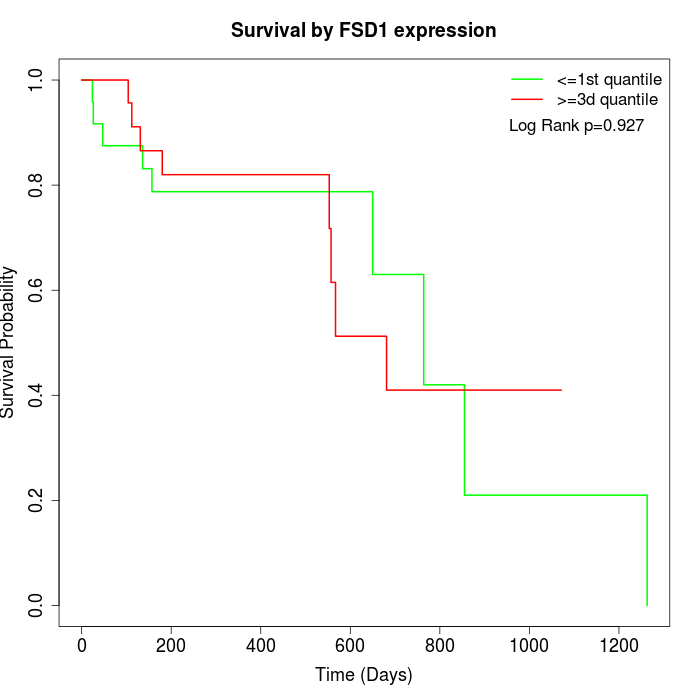 |
| GSE53622 | GSE53624 | TCGA |
Note: Click image to view full size file.
Copy number change of FSD1:
| Dataset | Gene | EntrezID | Gain | Loss | Normal | Detail |
|---|---|---|---|---|---|---|
| GSE15526 | FSD1 | 79187 | 5 | 3 | 22 | |
| GSE20123 | FSD1 | 79187 | 4 | 2 | 24 | |
| GSE43470 | FSD1 | 79187 | 1 | 8 | 34 | |
| GSE46452 | FSD1 | 79187 | 47 | 1 | 11 | |
| GSE47630 | FSD1 | 79187 | 5 | 7 | 28 | |
| GSE54993 | FSD1 | 79187 | 16 | 3 | 51 | |
| GSE54994 | FSD1 | 79187 | 6 | 16 | 31 | |
| GSE60625 | FSD1 | 79187 | 9 | 0 | 2 | |
| GSE74703 | FSD1 | 79187 | 1 | 5 | 30 | |
| GSE74704 | FSD1 | 79187 | 1 | 2 | 17 | |
| TCGA | FSD1 | 79187 | 11 | 18 | 67 |
Total number of gains: 106; Total number of losses: 65; Total Number of normals: 317.
Somatic mutations of FSD1:
Generating mutation plots.
Highly correlated genes for FSD1:
Showing top 20/53 corelated genes with mean PCC>0.5.
| Gene1 | Gene2 | Mean PCC | Num. Datasets | Num. PCC<0 | Num. PCC>0.5 |
|---|---|---|---|---|---|
| FSD1 | ZBP1 | 0.68877 | 3 | 0 | 3 |
| FSD1 | C4BPA | 0.619086 | 4 | 0 | 3 |
| FSD1 | ABTB2 | 0.605387 | 4 | 0 | 3 |
| FSD1 | BRF1 | 0.600703 | 4 | 0 | 4 |
| FSD1 | VWA5B1 | 0.600477 | 4 | 0 | 3 |
| FSD1 | IL21R | 0.592952 | 5 | 0 | 4 |
| FSD1 | ICAM2 | 0.580039 | 5 | 0 | 3 |
| FSD1 | CYP46A1 | 0.57896 | 5 | 0 | 3 |
| FSD1 | LIPE-AS1 | 0.577341 | 3 | 0 | 3 |
| FSD1 | PDE10A | 0.572105 | 4 | 0 | 3 |
| FSD1 | TULP2 | 0.569054 | 3 | 0 | 3 |
| FSD1 | HCK | 0.567358 | 4 | 0 | 3 |
| FSD1 | ZNF233 | 0.564991 | 3 | 0 | 3 |
| FSD1 | TP73 | 0.564861 | 3 | 0 | 3 |
| FSD1 | NPTX2 | 0.561018 | 5 | 0 | 4 |
| FSD1 | IGF2-AS | 0.560561 | 4 | 0 | 3 |
| FSD1 | F5 | 0.558706 | 3 | 0 | 3 |
| FSD1 | LEP | 0.553383 | 5 | 0 | 4 |
| FSD1 | RNF165 | 0.552953 | 3 | 0 | 3 |
| FSD1 | CHIT1 | 0.55067 | 3 | 0 | 3 |
For details and further investigation, click here