| Full name: Z-DNA binding protein 1 | Alias Symbol: dJ718J7.3|DLM1|DLM-1|DAI | ||
| Type: protein-coding gene | Cytoband: 20q13.31 | ||
| Entrez ID: 81030 | HGNC ID: HGNC:16176 | Ensembl Gene: ENSG00000124256 | OMIM ID: 606750 |
ZBP1 involved pathways:
| KEGG pathway | Description | View |
|---|---|---|
| hsa04623 | Cytosolic DNA-sensing pathway |
Expression of ZBP1:
| Dataset | Gene | EntrezID | Probe | Log2FC | Adj.pValue | Expression |
|---|---|---|---|---|---|---|
| GSE17351 | ZBP1 | 81030 | 208087_s_at | 0.2477 | 0.3680 | |
| GSE20347 | ZBP1 | 81030 | 208087_s_at | 0.0343 | 0.6932 | |
| GSE23400 | ZBP1 | 81030 | 208087_s_at | -0.0048 | 0.8983 | |
| GSE26886 | ZBP1 | 81030 | 208087_s_at | 0.2032 | 0.2191 | |
| GSE29001 | ZBP1 | 81030 | 208087_s_at | 0.4446 | 0.0210 | |
| GSE38129 | ZBP1 | 81030 | 208087_s_at | 0.0178 | 0.8502 | |
| GSE45670 | ZBP1 | 81030 | 208087_s_at | 0.3110 | 0.0839 | |
| GSE53622 | ZBP1 | 81030 | 1303 | 0.6742 | 0.0000 | |
| GSE53624 | ZBP1 | 81030 | 1303 | 0.5776 | 0.0001 | |
| GSE63941 | ZBP1 | 81030 | 208087_s_at | 0.0924 | 0.6216 | |
| GSE77861 | ZBP1 | 81030 | 208087_s_at | -0.0198 | 0.9284 | |
| GSE97050 | ZBP1 | 81030 | A_33_P3357609 | 1.0713 | 0.1242 | |
| SRP007169 | ZBP1 | 81030 | RNAseq | 0.2069 | 0.7925 | |
| SRP064894 | ZBP1 | 81030 | RNAseq | 1.3592 | 0.0001 | |
| SRP133303 | ZBP1 | 81030 | RNAseq | 0.4823 | 0.0317 | |
| SRP159526 | ZBP1 | 81030 | RNAseq | 0.0122 | 0.9880 | |
| SRP193095 | ZBP1 | 81030 | RNAseq | 0.6418 | 0.0384 | |
| SRP219564 | ZBP1 | 81030 | RNAseq | 1.8186 | 0.0205 | |
| TCGA | ZBP1 | 81030 | RNAseq | 0.4565 | 0.2094 |
Upregulated datasets: 2; Downregulated datasets: 0.
Survival by ZBP1 expression:
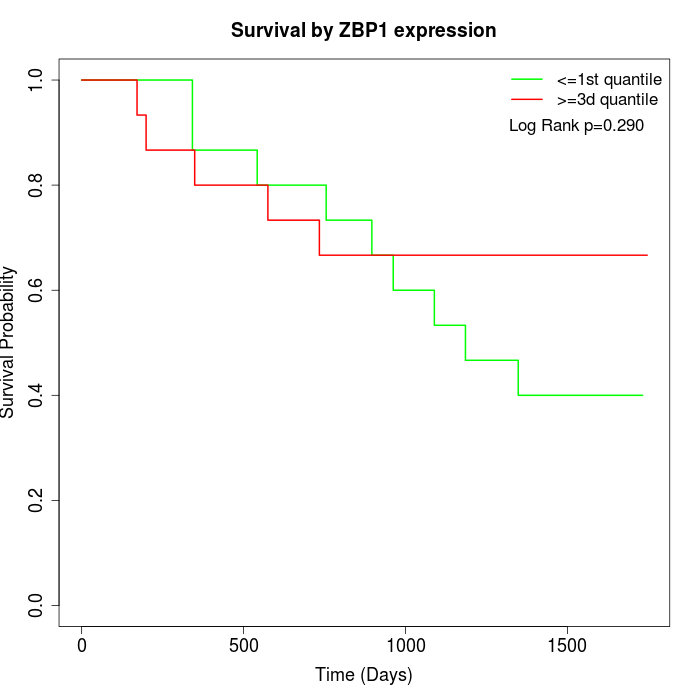 | 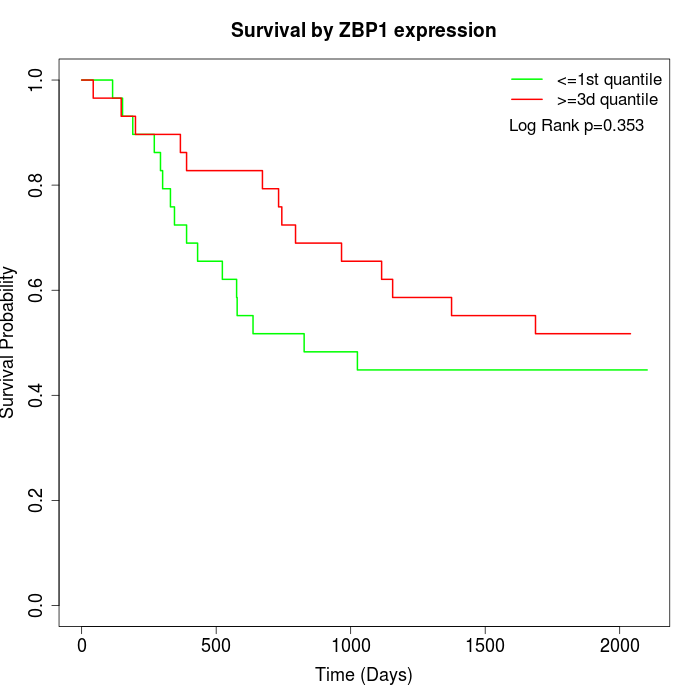 | 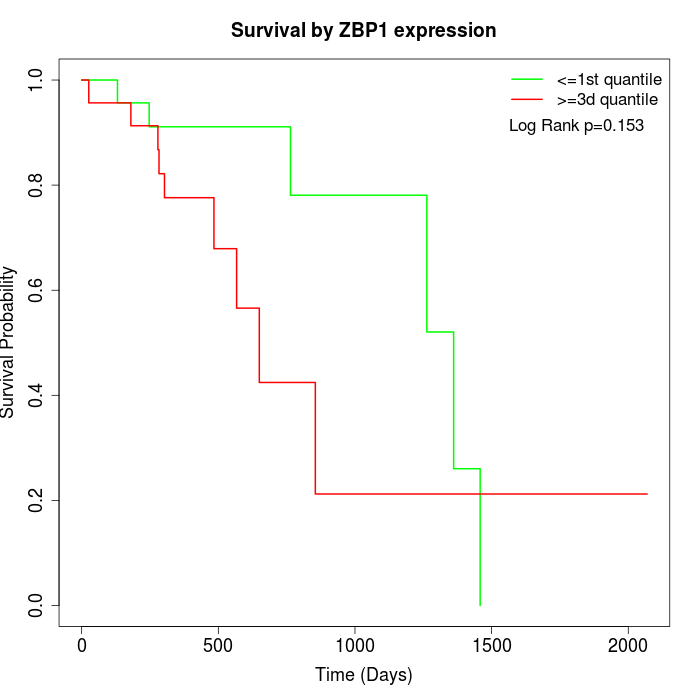 |
| GSE53622 | GSE53624 | TCGA |
Note: Click image to view full size file.
Copy number change of ZBP1:
| Dataset | Gene | EntrezID | Gain | Loss | Normal | Detail |
|---|---|---|---|---|---|---|
| GSE15526 | ZBP1 | 81030 | 14 | 2 | 14 | |
| GSE20123 | ZBP1 | 81030 | 14 | 2 | 14 | |
| GSE43470 | ZBP1 | 81030 | 13 | 0 | 30 | |
| GSE46452 | ZBP1 | 81030 | 29 | 0 | 30 | |
| GSE47630 | ZBP1 | 81030 | 24 | 1 | 15 | |
| GSE54993 | ZBP1 | 81030 | 0 | 17 | 53 | |
| GSE54994 | ZBP1 | 81030 | 29 | 0 | 24 | |
| GSE60625 | ZBP1 | 81030 | 0 | 0 | 11 | |
| GSE74703 | ZBP1 | 81030 | 11 | 0 | 25 | |
| GSE74704 | ZBP1 | 81030 | 11 | 0 | 9 | |
| TCGA | ZBP1 | 81030 | 43 | 4 | 49 |
Total number of gains: 188; Total number of losses: 26; Total Number of normals: 274.
Somatic mutations of ZBP1:
Generating mutation plots.
Highly correlated genes for ZBP1:
Showing top 20/313 corelated genes with mean PCC>0.5.
| Gene1 | Gene2 | Mean PCC | Num. Datasets | Num. PCC<0 | Num. PCC>0.5 |
|---|---|---|---|---|---|
| ZBP1 | KLHL6 | 0.715638 | 4 | 0 | 4 |
| ZBP1 | FSD1 | 0.68877 | 3 | 0 | 3 |
| ZBP1 | POLG2 | 0.68828 | 3 | 0 | 3 |
| ZBP1 | KLHDC7B | 0.688251 | 5 | 0 | 4 |
| ZBP1 | C2orf80 | 0.681562 | 3 | 0 | 3 |
| ZBP1 | PSMB10 | 0.679013 | 4 | 0 | 4 |
| ZBP1 | FAM78A | 0.670958 | 4 | 0 | 3 |
| ZBP1 | SLC29A4 | 0.668039 | 3 | 0 | 3 |
| ZBP1 | LAX1 | 0.655347 | 4 | 0 | 4 |
| ZBP1 | TIGIT | 0.652531 | 7 | 0 | 6 |
| ZBP1 | LAIR1 | 0.651937 | 6 | 0 | 5 |
| ZBP1 | USP30-AS1 | 0.651018 | 4 | 0 | 4 |
| ZBP1 | IFIH1 | 0.646419 | 4 | 0 | 3 |
| ZBP1 | NMI | 0.646041 | 5 | 0 | 5 |
| ZBP1 | PTPN6 | 0.644804 | 4 | 0 | 4 |
| ZBP1 | BTN3A2 | 0.642499 | 3 | 0 | 3 |
| ZBP1 | RTP4 | 0.641345 | 5 | 0 | 5 |
| ZBP1 | OASL | 0.641251 | 7 | 0 | 6 |
| ZBP1 | HLA-F | 0.640522 | 5 | 0 | 4 |
| ZBP1 | CMPK2 | 0.639939 | 5 | 0 | 5 |
For details and further investigation, click here