| Full name: gamma-aminobutyric acid type A receptor alpha1 subunit | Alias Symbol: EJM5 | ||
| Type: protein-coding gene | Cytoband: 5q34 | ||
| Entrez ID: 2554 | HGNC ID: HGNC:4075 | Ensembl Gene: ENSG00000022355 | OMIM ID: 137160 |
| Related drugs: ACAMPROSATE CALCIUM, ADINAZOLAM, ADIPIPLON, ALCOHOL, ALPRAZOLAM, AMOBARBITAL, BARBITAL, BARBITURIC ACID, BICUCULLINE, BRETAZENIL... [more] | |||
GABRA1 involved pathways:
| KEGG pathway | Description | View |
|---|---|---|
| hsa04727 | GABAergic synapse | |
| hsa04742 | Taste transduction | |
| hsa05032 | Morphine addiction |
Expression of GABRA1:
| Dataset | Gene | EntrezID | Probe | Log2FC | Adj.pValue | Expression |
|---|---|---|---|---|---|---|
| GSE17351 | GABRA1 | 2554 | 206678_at | -0.2275 | 0.2617 | |
| GSE20347 | GABRA1 | 2554 | 206678_at | -0.0044 | 0.9525 | |
| GSE23400 | GABRA1 | 2554 | 206678_at | -0.1146 | 0.0035 | |
| GSE26886 | GABRA1 | 2554 | 206678_at | -0.0217 | 0.8728 | |
| GSE29001 | GABRA1 | 2554 | 206678_at | 0.0124 | 0.9434 | |
| GSE38129 | GABRA1 | 2554 | 206678_at | -0.0715 | 0.2696 | |
| GSE45670 | GABRA1 | 2554 | 206678_at | 0.0970 | 0.1965 | |
| GSE53622 | GABRA1 | 2554 | 17005 | -0.2871 | 0.0139 | |
| GSE53624 | GABRA1 | 2554 | 17005 | -0.1430 | 0.1750 | |
| GSE63941 | GABRA1 | 2554 | 206678_at | 0.1357 | 0.2868 | |
| GSE77861 | GABRA1 | 2554 | 206678_at | -0.0748 | 0.4995 | |
| TCGA | GABRA1 | 2554 | RNAseq | -2.6485 | 0.0659 |
Upregulated datasets: 0; Downregulated datasets: 0.
Survival by GABRA1 expression:
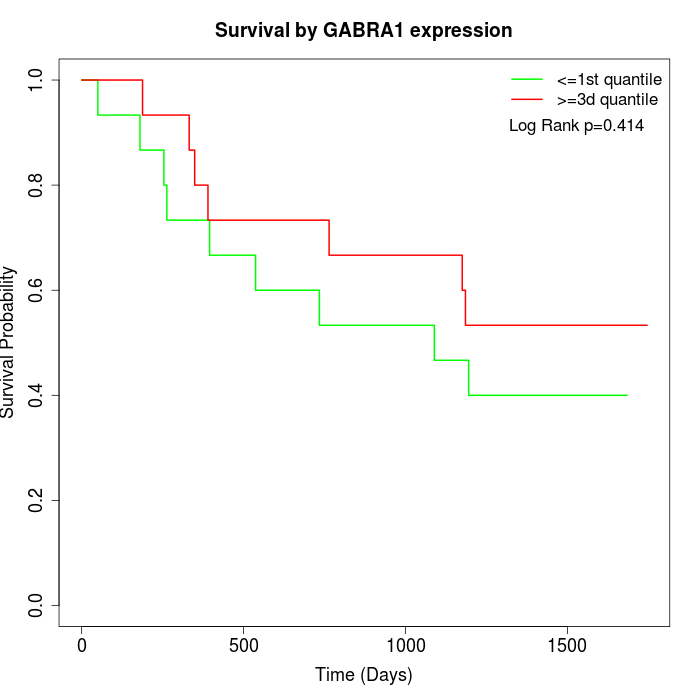 | 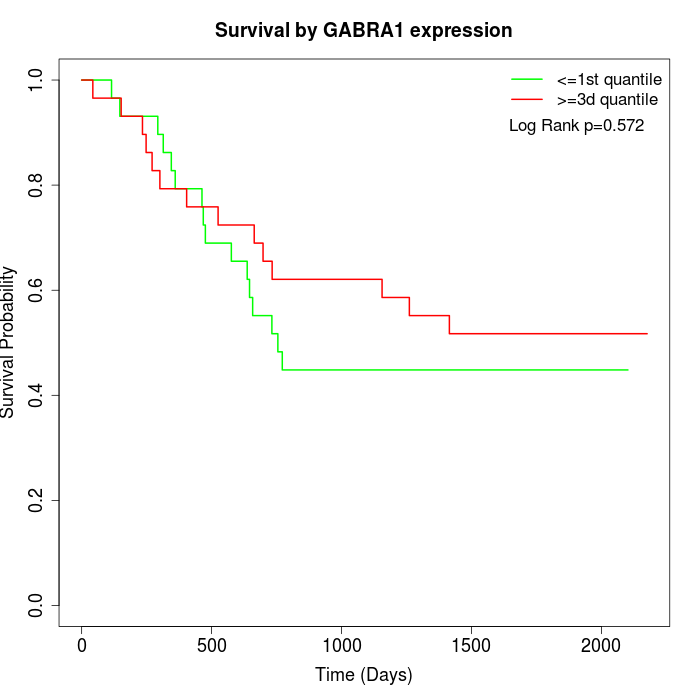 | 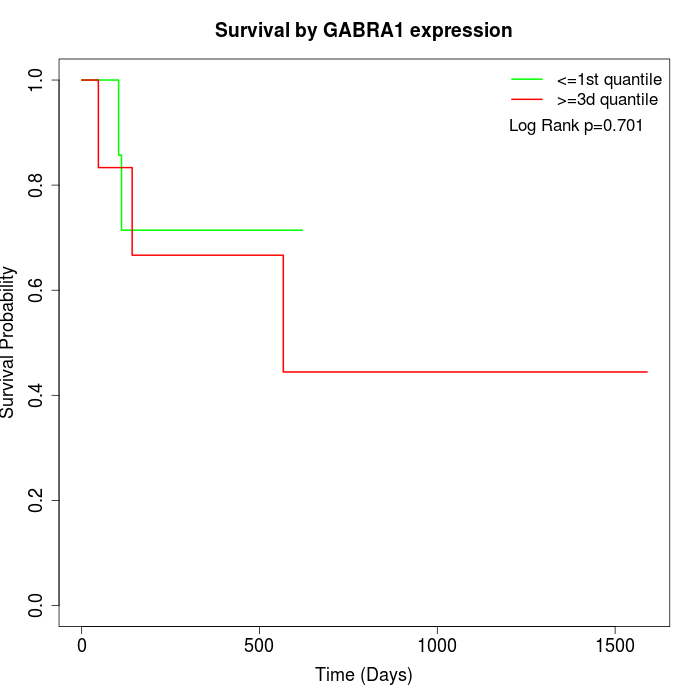 |
| GSE53622 | GSE53624 | TCGA |
Note: Click image to view full size file.
Copy number change of GABRA1:
| Dataset | Gene | EntrezID | Gain | Loss | Normal | Detail |
|---|---|---|---|---|---|---|
| GSE15526 | GABRA1 | 2554 | 0 | 12 | 18 | |
| GSE20123 | GABRA1 | 2554 | 0 | 12 | 18 | |
| GSE43470 | GABRA1 | 2554 | 2 | 10 | 31 | |
| GSE46452 | GABRA1 | 2554 | 0 | 27 | 32 | |
| GSE47630 | GABRA1 | 2554 | 0 | 20 | 20 | |
| GSE54993 | GABRA1 | 2554 | 9 | 2 | 59 | |
| GSE54994 | GABRA1 | 2554 | 2 | 15 | 36 | |
| GSE60625 | GABRA1 | 2554 | 0 | 0 | 11 | |
| GSE74703 | GABRA1 | 2554 | 2 | 8 | 26 | |
| GSE74704 | GABRA1 | 2554 | 0 | 7 | 13 | |
| TCGA | GABRA1 | 2554 | 6 | 37 | 53 |
Total number of gains: 21; Total number of losses: 150; Total Number of normals: 317.
Somatic mutations of GABRA1:
Generating mutation plots.
Highly correlated genes for GABRA1:
Showing top 20/735 corelated genes with mean PCC>0.5.
| Gene1 | Gene2 | Mean PCC | Num. Datasets | Num. PCC<0 | Num. PCC>0.5 |
|---|---|---|---|---|---|
| GABRA1 | NPTXR | 0.732444 | 4 | 0 | 4 |
| GABRA1 | GAL3ST4 | 0.705114 | 3 | 0 | 3 |
| GABRA1 | INSL5 | 0.703242 | 3 | 0 | 3 |
| GABRA1 | KCNMB2 | 0.701094 | 5 | 0 | 4 |
| GABRA1 | DIO3 | 0.700628 | 3 | 0 | 3 |
| GABRA1 | AICDA | 0.696129 | 3 | 0 | 3 |
| GABRA1 | GIP | 0.689828 | 3 | 0 | 3 |
| GABRA1 | NTNG1 | 0.688914 | 3 | 0 | 3 |
| GABRA1 | SORCS3-AS1 | 0.686405 | 3 | 0 | 3 |
| GABRA1 | RABEP2 | 0.683206 | 4 | 0 | 4 |
| GABRA1 | CBLN1 | 0.682456 | 4 | 0 | 4 |
| GABRA1 | CCL1 | 0.67416 | 5 | 0 | 5 |
| GABRA1 | FGF4 | 0.672205 | 4 | 0 | 4 |
| GABRA1 | PTPRJ | 0.670232 | 3 | 0 | 3 |
| GABRA1 | RRH | 0.66785 | 3 | 0 | 3 |
| GABRA1 | CAMKV | 0.665832 | 5 | 0 | 5 |
| GABRA1 | CLDN14 | 0.665605 | 3 | 0 | 3 |
| GABRA1 | HOXC5 | 0.662845 | 3 | 0 | 3 |
| GABRA1 | EDDM3A | 0.662843 | 5 | 0 | 3 |
| GABRA1 | KSR1 | 0.659579 | 4 | 0 | 3 |
For details and further investigation, click here