| Full name: gastric inhibitory polypeptide | Alias Symbol: | ||
| Type: protein-coding gene | Cytoband: 17q21.32 | ||
| Entrez ID: 2695 | HGNC ID: HGNC:4270 | Ensembl Gene: ENSG00000159224 | OMIM ID: 137240 |
GIP involved pathways:
| KEGG pathway | Description | View |
|---|---|---|
| hsa04911 | Insulin secretion |
Expression of GIP:
| Dataset | Gene | EntrezID | Probe | Log2FC | Adj.pValue | Expression |
|---|---|---|---|---|---|---|
| GSE17351 | GIP | 2695 | 207899_at | -0.1121 | 0.6140 | |
| GSE20347 | GIP | 2695 | 207899_at | 0.0460 | 0.3682 | |
| GSE23400 | GIP | 2695 | 207899_at | -0.0580 | 0.0316 | |
| GSE26886 | GIP | 2695 | 207899_at | -0.0317 | 0.7730 | |
| GSE29001 | GIP | 2695 | 207899_at | 0.0143 | 0.9237 | |
| GSE38129 | GIP | 2695 | 207899_at | -0.0056 | 0.9190 | |
| GSE45670 | GIP | 2695 | 207899_at | 0.0379 | 0.6794 | |
| GSE53622 | GIP | 2695 | 12928 | -0.1964 | 0.0151 | |
| GSE53624 | GIP | 2695 | 12928 | -0.1231 | 0.1413 | |
| GSE63941 | GIP | 2695 | 207899_at | 0.0575 | 0.7605 | |
| GSE77861 | GIP | 2695 | 207899_at | -0.1740 | 0.0434 | |
| GSE97050 | GIP | 2695 | A_23_P141459 | -0.0774 | 0.7322 | |
| TCGA | GIP | 2695 | RNAseq | 0.9845 | 0.6654 |
Upregulated datasets: 0; Downregulated datasets: 0.
Survival by GIP expression:
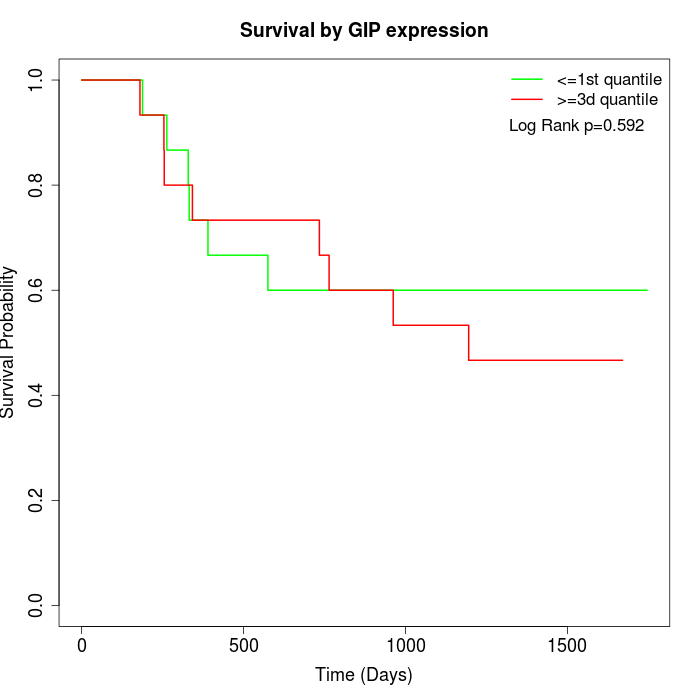 | 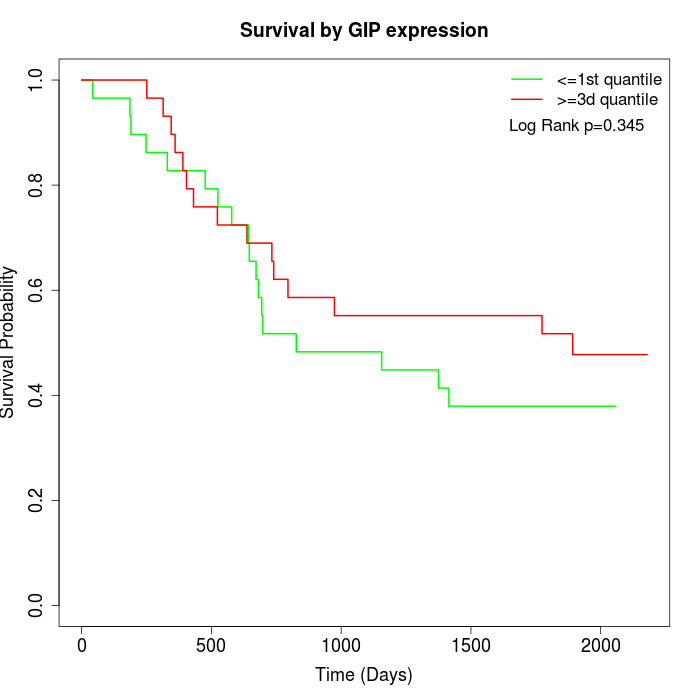 | 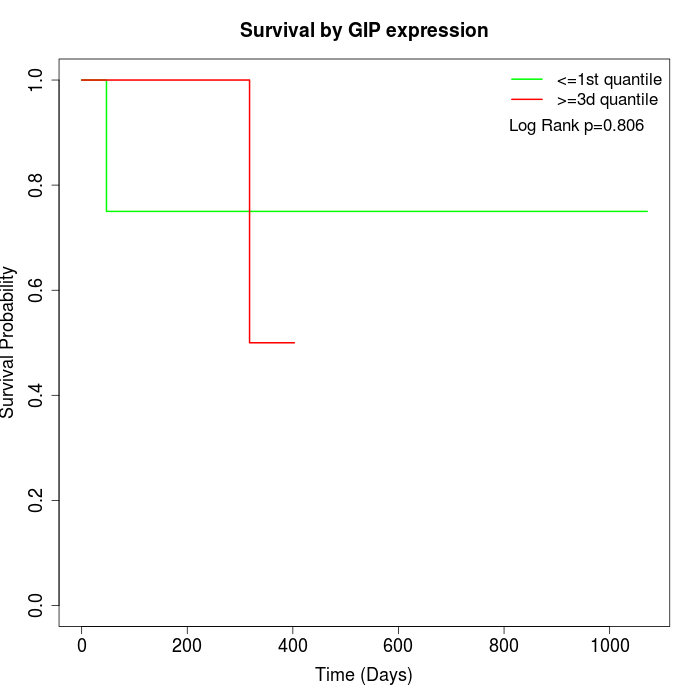 |
| GSE53622 | GSE53624 | TCGA |
Note: Click image to view full size file.
Copy number change of GIP:
| Dataset | Gene | EntrezID | Gain | Loss | Normal | Detail |
|---|---|---|---|---|---|---|
| GSE15526 | GIP | 2695 | 6 | 2 | 22 | |
| GSE20123 | GIP | 2695 | 6 | 2 | 22 | |
| GSE43470 | GIP | 2695 | 3 | 2 | 38 | |
| GSE46452 | GIP | 2695 | 32 | 0 | 27 | |
| GSE47630 | GIP | 2695 | 9 | 0 | 31 | |
| GSE54993 | GIP | 2695 | 2 | 4 | 64 | |
| GSE54994 | GIP | 2695 | 10 | 6 | 37 | |
| GSE60625 | GIP | 2695 | 4 | 0 | 7 | |
| GSE74703 | GIP | 2695 | 3 | 2 | 31 | |
| GSE74704 | GIP | 2695 | 4 | 1 | 15 | |
| TCGA | GIP | 2695 | 26 | 7 | 63 |
Total number of gains: 105; Total number of losses: 26; Total Number of normals: 357.
Somatic mutations of GIP:
Generating mutation plots.
Highly correlated genes for GIP:
Showing top 20/442 corelated genes with mean PCC>0.5.
| Gene1 | Gene2 | Mean PCC | Num. Datasets | Num. PCC<0 | Num. PCC>0.5 |
|---|---|---|---|---|---|
| GIP | OR7E24 | 0.720761 | 3 | 0 | 3 |
| GIP | CTNNA2 | 0.700856 | 3 | 0 | 3 |
| GIP | DRD2 | 0.695562 | 3 | 0 | 3 |
| GIP | TFF1 | 0.694089 | 3 | 0 | 3 |
| GIP | PHEX | 0.692728 | 3 | 0 | 3 |
| GIP | GABRA1 | 0.689828 | 3 | 0 | 3 |
| GIP | TBXA2R | 0.683803 | 4 | 0 | 4 |
| GIP | TNXB | 0.680449 | 3 | 0 | 3 |
| GIP | SLC6A13 | 0.671405 | 3 | 0 | 3 |
| GIP | TMEM8B | 0.671343 | 4 | 0 | 3 |
| GIP | SIRT3 | 0.670793 | 3 | 0 | 3 |
| GIP | RTP5 | 0.668699 | 3 | 0 | 3 |
| GIP | PHF7 | 0.666795 | 3 | 0 | 3 |
| GIP | ALX3 | 0.666112 | 3 | 0 | 3 |
| GIP | DAB1 | 0.665633 | 3 | 0 | 3 |
| GIP | CCL1 | 0.663275 | 4 | 0 | 4 |
| GIP | C8B | 0.663267 | 4 | 0 | 3 |
| GIP | TULP2 | 0.662153 | 4 | 0 | 4 |
| GIP | CRX | 0.662081 | 3 | 0 | 3 |
| GIP | AGTR2 | 0.661435 | 6 | 0 | 6 |
For details and further investigation, click here