| Full name: glial cells missing transcription factor 1 | Alias Symbol: hGCMa | ||
| Type: protein-coding gene | Cytoband: 6p12.1 | ||
| Entrez ID: 8521 | HGNC ID: HGNC:4197 | Ensembl Gene: ENSG00000137270 | OMIM ID: 603715 |
Expression of GCM1:
| Dataset | Gene | EntrezID | Probe | Log2FC | Adj.pValue | Expression |
|---|---|---|---|---|---|---|
| GSE17351 | GCM1 | 8521 | 206269_at | -0.0652 | 0.8164 | |
| GSE20347 | GCM1 | 8521 | 206269_at | -0.0453 | 0.5150 | |
| GSE23400 | GCM1 | 8521 | 206269_at | -0.0473 | 0.1251 | |
| GSE26886 | GCM1 | 8521 | 206269_at | 0.1821 | 0.1430 | |
| GSE29001 | GCM1 | 8521 | 206269_at | -0.0917 | 0.5093 | |
| GSE38129 | GCM1 | 8521 | 206269_at | -0.0458 | 0.5620 | |
| GSE45670 | GCM1 | 8521 | 206269_at | 0.1041 | 0.3723 | |
| GSE53622 | GCM1 | 8521 | 60855 | -0.1966 | 0.0329 | |
| GSE53624 | GCM1 | 8521 | 60855 | 0.1418 | 0.0721 | |
| GSE63941 | GCM1 | 8521 | 206269_at | 0.3426 | 0.6107 | |
| GSE77861 | GCM1 | 8521 | 206269_at | 0.0072 | 0.9568 | |
| SRP133303 | GCM1 | 8521 | RNAseq | -0.0502 | 0.7411 | |
| SRP193095 | GCM1 | 8521 | RNAseq | 0.0936 | 0.5692 | |
| SRP219564 | GCM1 | 8521 | RNAseq | 1.5532 | 0.0269 | |
| TCGA | GCM1 | 8521 | RNAseq | 2.0425 | 0.0208 |
Upregulated datasets: 2; Downregulated datasets: 0.
Survival by GCM1 expression:
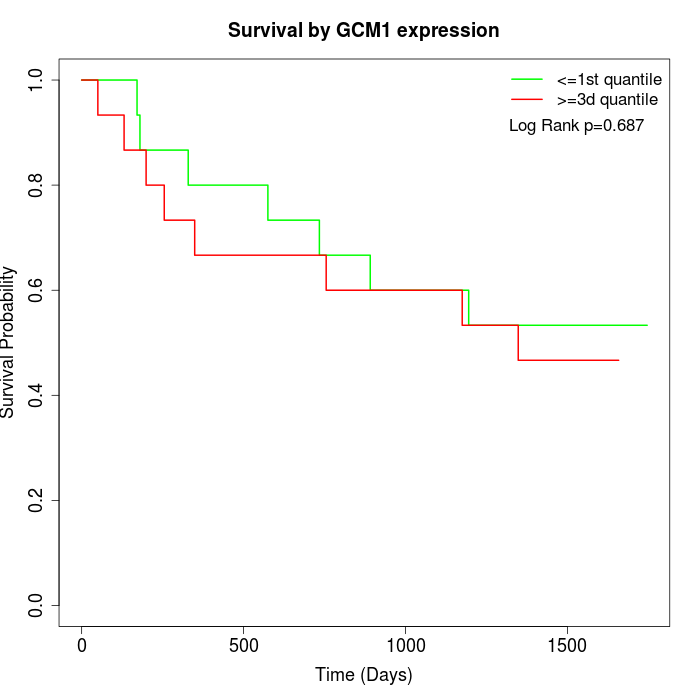 | 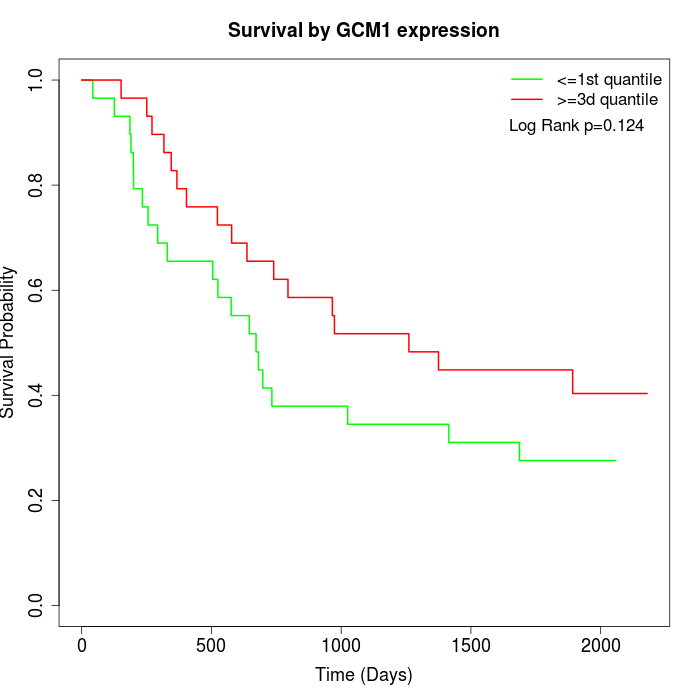 | 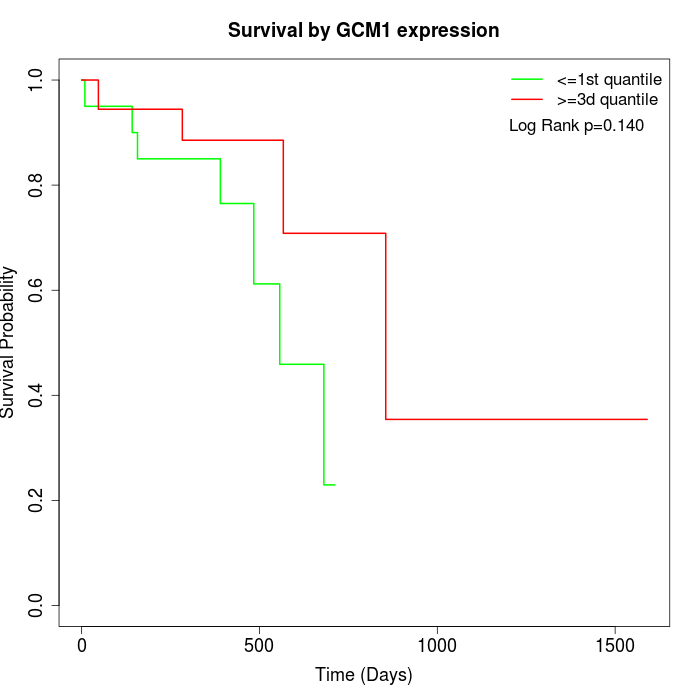 |
| GSE53622 | GSE53624 | TCGA |
Note: Click image to view full size file.
Copy number change of GCM1:
| Dataset | Gene | EntrezID | Gain | Loss | Normal | Detail |
|---|---|---|---|---|---|---|
| GSE15526 | GCM1 | 8521 | 6 | 3 | 21 | |
| GSE20123 | GCM1 | 8521 | 7 | 2 | 21 | |
| GSE43470 | GCM1 | 8521 | 5 | 0 | 38 | |
| GSE46452 | GCM1 | 8521 | 2 | 10 | 47 | |
| GSE47630 | GCM1 | 8521 | 7 | 5 | 28 | |
| GSE54993 | GCM1 | 8521 | 3 | 1 | 66 | |
| GSE54994 | GCM1 | 8521 | 8 | 4 | 41 | |
| GSE60625 | GCM1 | 8521 | 0 | 3 | 8 | |
| GSE74703 | GCM1 | 8521 | 5 | 0 | 31 | |
| GSE74704 | GCM1 | 8521 | 2 | 1 | 17 | |
| TCGA | GCM1 | 8521 | 22 | 12 | 62 |
Total number of gains: 67; Total number of losses: 41; Total Number of normals: 380.
Somatic mutations of GCM1:
Generating mutation plots.
Highly correlated genes for GCM1:
Showing top 20/421 corelated genes with mean PCC>0.5.
| Gene1 | Gene2 | Mean PCC | Num. Datasets | Num. PCC<0 | Num. PCC>0.5 |
|---|---|---|---|---|---|
| GCM1 | MTTP | 0.740915 | 3 | 0 | 3 |
| GCM1 | NAT2 | 0.705544 | 3 | 0 | 3 |
| GCM1 | ATF7 | 0.686098 | 4 | 0 | 3 |
| GCM1 | IHH | 0.684963 | 3 | 0 | 3 |
| GCM1 | CGA | 0.678309 | 4 | 0 | 3 |
| GCM1 | IRS4 | 0.676397 | 4 | 0 | 4 |
| GCM1 | ZFHX2 | 0.675935 | 3 | 0 | 3 |
| GCM1 | HTR6 | 0.674713 | 4 | 0 | 3 |
| GCM1 | ENTPD2 | 0.67161 | 4 | 0 | 4 |
| GCM1 | LEFTY1 | 0.670425 | 4 | 0 | 3 |
| GCM1 | SEMA6A | 0.669246 | 4 | 0 | 4 |
| GCM1 | NCR2 | 0.668329 | 3 | 0 | 3 |
| GCM1 | FAM153A | 0.662663 | 5 | 0 | 5 |
| GCM1 | SLC6A5 | 0.660799 | 3 | 0 | 3 |
| GCM1 | LRRC75B | 0.659778 | 5 | 0 | 4 |
| GCM1 | P2RY4 | 0.658828 | 4 | 0 | 4 |
| GCM1 | ATRNL1 | 0.65637 | 4 | 0 | 3 |
| GCM1 | GJA8 | 0.653876 | 4 | 0 | 4 |
| GCM1 | KCNMB2 | 0.652966 | 4 | 0 | 4 |
| GCM1 | ZKSCAN8 | 0.651717 | 3 | 0 | 3 |
For details and further investigation, click here