| Full name: GDNF family receptor alpha 3 | Alias Symbol: GFRa-3 | ||
| Type: protein-coding gene | Cytoband: 5q31.2 | ||
| Entrez ID: 2676 | HGNC ID: HGNC:4245 | Ensembl Gene: ENSG00000146013 | OMIM ID: 605710 |
Expression of GFRA3:
| Dataset | Gene | EntrezID | Probe | Log2FC | Adj.pValue | Expression |
|---|---|---|---|---|---|---|
| GSE17351 | GFRA3 | 2676 | 229936_at | -0.8376 | 0.2334 | |
| GSE20347 | GFRA3 | 2676 | 214479_at | 0.0497 | 0.6718 | |
| GSE23400 | GFRA3 | 2676 | 214479_at | -0.1769 | 0.0000 | |
| GSE26886 | GFRA3 | 2676 | 229936_at | 0.8352 | 0.0022 | |
| GSE29001 | GFRA3 | 2676 | 214479_at | -0.2483 | 0.2111 | |
| GSE38129 | GFRA3 | 2676 | 214479_at | -0.1990 | 0.0496 | |
| GSE45670 | GFRA3 | 2676 | 229936_at | -0.8033 | 0.0009 | |
| GSE53622 | GFRA3 | 2676 | 159011 | -0.9520 | 0.0000 | |
| GSE53624 | GFRA3 | 2676 | 159011 | -0.8326 | 0.0000 | |
| GSE63941 | GFRA3 | 2676 | 229936_at | 0.1875 | 0.6739 | |
| GSE77861 | GFRA3 | 2676 | 214479_at | 0.1300 | 0.4440 | |
| GSE97050 | GFRA3 | 2676 | A_23_P41987 | -0.0110 | 0.9904 | |
| SRP133303 | GFRA3 | 2676 | RNAseq | -0.9456 | 0.0998 | |
| SRP159526 | GFRA3 | 2676 | RNAseq | 0.0426 | 0.9264 | |
| SRP219564 | GFRA3 | 2676 | RNAseq | 0.0766 | 0.9533 | |
| TCGA | GFRA3 | 2676 | RNAseq | -0.9233 | 0.0109 |
Upregulated datasets: 0; Downregulated datasets: 0.
Survival by GFRA3 expression:
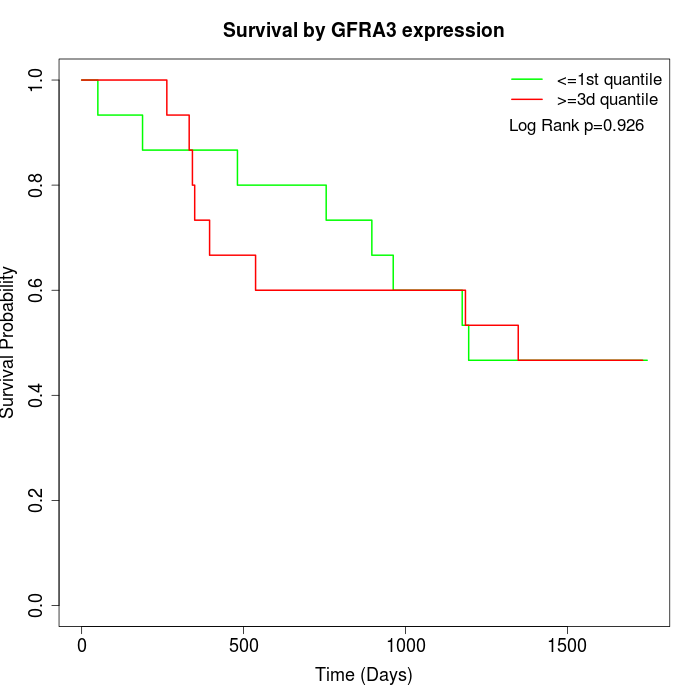 | 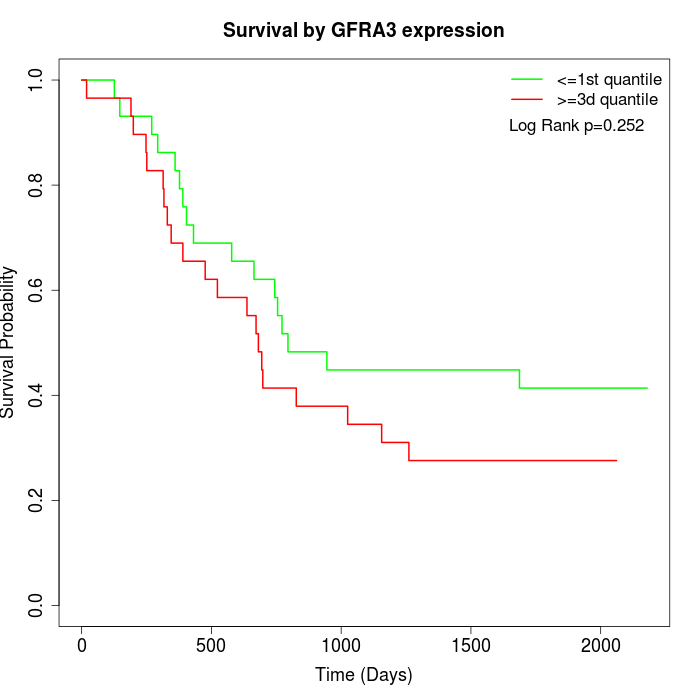 | 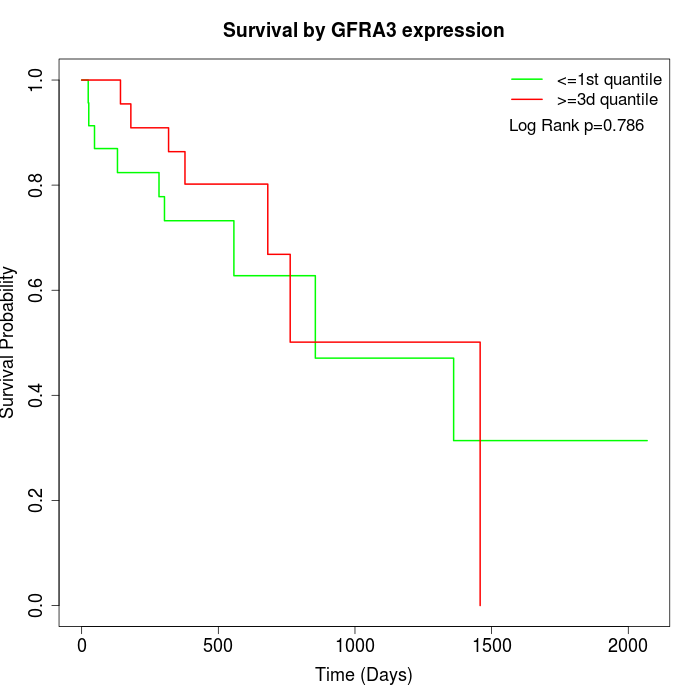 |
| GSE53622 | GSE53624 | TCGA |
Note: Click image to view full size file.
Copy number change of GFRA3:
| Dataset | Gene | EntrezID | Gain | Loss | Normal | Detail |
|---|---|---|---|---|---|---|
| GSE15526 | GFRA3 | 2676 | 3 | 10 | 17 | |
| GSE20123 | GFRA3 | 2676 | 4 | 10 | 16 | |
| GSE43470 | GFRA3 | 2676 | 4 | 5 | 34 | |
| GSE46452 | GFRA3 | 2676 | 0 | 27 | 32 | |
| GSE47630 | GFRA3 | 2676 | 0 | 21 | 19 | |
| GSE54993 | GFRA3 | 2676 | 9 | 1 | 60 | |
| GSE54994 | GFRA3 | 2676 | 3 | 13 | 37 | |
| GSE60625 | GFRA3 | 2676 | 0 | 0 | 11 | |
| GSE74703 | GFRA3 | 2676 | 3 | 4 | 29 | |
| GSE74704 | GFRA3 | 2676 | 3 | 4 | 13 | |
| TCGA | GFRA3 | 2676 | 4 | 37 | 55 |
Total number of gains: 33; Total number of losses: 132; Total Number of normals: 323.
Somatic mutations of GFRA3:
Generating mutation plots.
Highly correlated genes for GFRA3:
Showing top 20/946 corelated genes with mean PCC>0.5.
| Gene1 | Gene2 | Mean PCC | Num. Datasets | Num. PCC<0 | Num. PCC>0.5 |
|---|---|---|---|---|---|
| GFRA3 | ADRB3 | 0.79117 | 3 | 0 | 3 |
| GFRA3 | KRTAP1-3 | 0.747448 | 3 | 0 | 3 |
| GFRA3 | FIBIN | 0.741129 | 3 | 0 | 3 |
| GFRA3 | SMR3B | 0.739391 | 3 | 0 | 3 |
| GFRA3 | SORCS1 | 0.738914 | 4 | 0 | 4 |
| GFRA3 | KCNC1 | 0.737199 | 3 | 0 | 3 |
| GFRA3 | FGF12 | 0.735056 | 3 | 0 | 3 |
| GFRA3 | GSX1 | 0.727921 | 3 | 0 | 3 |
| GFRA3 | INMT | 0.727702 | 5 | 0 | 5 |
| GFRA3 | PARD3B | 0.726089 | 4 | 0 | 4 |
| GFRA3 | DACT3 | 0.725919 | 4 | 0 | 4 |
| GFRA3 | NEGR1 | 0.720804 | 5 | 0 | 5 |
| GFRA3 | SLC26A11 | 0.713228 | 3 | 0 | 3 |
| GFRA3 | DTNA | 0.7101 | 7 | 0 | 6 |
| GFRA3 | MIR100HG | 0.70596 | 4 | 0 | 4 |
| GFRA3 | KCNT2 | 0.7053 | 6 | 0 | 6 |
| GFRA3 | C1QTNF7 | 0.702428 | 5 | 0 | 5 |
| GFRA3 | RAB9B | 0.696336 | 6 | 0 | 6 |
| GFRA3 | CPXM2 | 0.694622 | 5 | 0 | 5 |
| GFRA3 | RASSF3 | 0.692187 | 4 | 0 | 4 |
For details and further investigation, click here