| Full name: glycoprotein A33 | Alias Symbol: A33 | ||
| Type: protein-coding gene | Cytoband: 1q24.1 | ||
| Entrez ID: 10223 | HGNC ID: HGNC:4445 | Ensembl Gene: ENSG00000143167 | OMIM ID: 602171 |
| Related drugs: KRN-330... [more] | |||
Expression of GPA33:
| Dataset | Gene | EntrezID | Probe | Log2FC | Adj.pValue | Expression |
|---|---|---|---|---|---|---|
| GSE17351 | GPA33 | 10223 | 205929_at | 0.0704 | 0.7432 | |
| GSE20347 | GPA33 | 10223 | 205929_at | 0.0950 | 0.4893 | |
| GSE23400 | GPA33 | 10223 | 205929_at | -0.0158 | 0.7222 | |
| GSE26886 | GPA33 | 10223 | 205929_at | -0.0903 | 0.6303 | |
| GSE29001 | GPA33 | 10223 | 205929_at | -0.0138 | 0.9525 | |
| GSE38129 | GPA33 | 10223 | 205929_at | -0.0355 | 0.7555 | |
| GSE45670 | GPA33 | 10223 | 205929_at | 0.1423 | 0.2323 | |
| GSE53622 | GPA33 | 10223 | 73325 | -0.2989 | 0.0954 | |
| GSE53624 | GPA33 | 10223 | 73325 | -0.2433 | 0.1494 | |
| GSE63941 | GPA33 | 10223 | 205929_at | -0.0340 | 0.8451 | |
| GSE77861 | GPA33 | 10223 | 205929_at | -0.1002 | 0.4244 | |
| GSE97050 | GPA33 | 10223 | A_24_P319374 | 0.4516 | 0.1163 | |
| TCGA | GPA33 | 10223 | RNAseq | -1.2477 | 0.0185 |
Upregulated datasets: 0; Downregulated datasets: 1.
Survival by GPA33 expression:
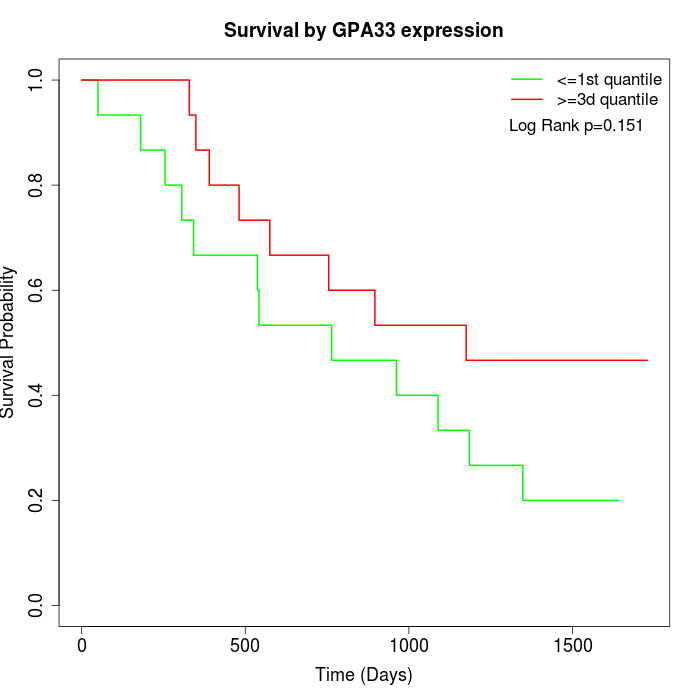 | 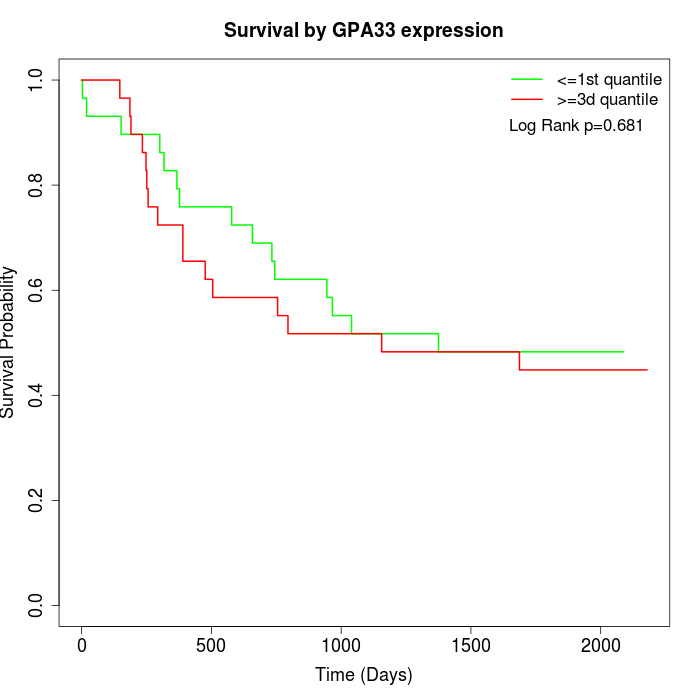 | 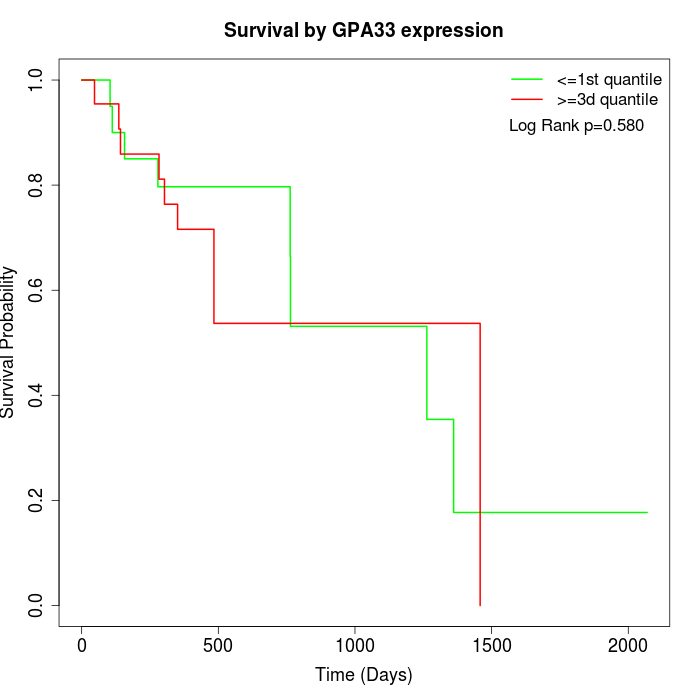 |
| GSE53622 | GSE53624 | TCGA |
Note: Click image to view full size file.
Copy number change of GPA33:
| Dataset | Gene | EntrezID | Gain | Loss | Normal | Detail |
|---|---|---|---|---|---|---|
| GSE15526 | GPA33 | 10223 | 11 | 1 | 18 | |
| GSE20123 | GPA33 | 10223 | 11 | 1 | 18 | |
| GSE43470 | GPA33 | 10223 | 7 | 2 | 34 | |
| GSE46452 | GPA33 | 10223 | 3 | 1 | 55 | |
| GSE47630 | GPA33 | 10223 | 14 | 0 | 26 | |
| GSE54993 | GPA33 | 10223 | 0 | 5 | 65 | |
| GSE54994 | GPA33 | 10223 | 16 | 0 | 37 | |
| GSE60625 | GPA33 | 10223 | 0 | 0 | 11 | |
| GSE74703 | GPA33 | 10223 | 7 | 2 | 27 | |
| GSE74704 | GPA33 | 10223 | 5 | 0 | 15 | |
| TCGA | GPA33 | 10223 | 44 | 3 | 49 |
Total number of gains: 118; Total number of losses: 15; Total Number of normals: 355.
Somatic mutations of GPA33:
Generating mutation plots.
Highly correlated genes for GPA33:
Showing top 20/711 corelated genes with mean PCC>0.5.
| Gene1 | Gene2 | Mean PCC | Num. Datasets | Num. PCC<0 | Num. PCC>0.5 |
|---|---|---|---|---|---|
| GPA33 | MTAP | 0.760774 | 5 | 0 | 5 |
| GPA33 | POU5F1B | 0.75391 | 3 | 0 | 3 |
| GPA33 | RPGRIP1 | 0.744368 | 4 | 0 | 4 |
| GPA33 | FZD4 | 0.734057 | 3 | 0 | 3 |
| GPA33 | PSKH1 | 0.728952 | 3 | 0 | 3 |
| GPA33 | IFNA10 | 0.725702 | 4 | 0 | 4 |
| GPA33 | NEUROD2 | 0.72335 | 4 | 0 | 4 |
| GPA33 | ARHGEF15 | 0.723289 | 3 | 0 | 3 |
| GPA33 | KIR2DL1 | 0.720144 | 5 | 0 | 5 |
| GPA33 | SLC2A5 | 0.719671 | 4 | 0 | 4 |
| GPA33 | KCNA1 | 0.717336 | 6 | 0 | 5 |
| GPA33 | RAB37 | 0.706499 | 3 | 0 | 3 |
| GPA33 | KIR2DS3 | 0.706055 | 4 | 0 | 4 |
| GPA33 | PPP5C | 0.70184 | 5 | 0 | 5 |
| GPA33 | NTNG1 | 0.700117 | 4 | 0 | 4 |
| GPA33 | E2F4 | 0.698555 | 6 | 0 | 5 |
| GPA33 | CHST4 | 0.695213 | 5 | 0 | 4 |
| GPA33 | CD34 | 0.69513 | 3 | 0 | 3 |
| GPA33 | DRD5 | 0.694896 | 6 | 0 | 6 |
| GPA33 | DNAAF1 | 0.694798 | 5 | 0 | 5 |
For details and further investigation, click here