| Full name: glypican 2 | Alias Symbol: cerebroglycan|FLJ38962|DKFZp547M109 | ||
| Type: protein-coding gene | Cytoband: 7q22.1 | ||
| Entrez ID: 221914 | HGNC ID: HGNC:4450 | Ensembl Gene: ENSG00000213420 | OMIM ID: |
Expression of GPC2:
| Dataset | Gene | EntrezID | Probe | Log2FC | Adj.pValue | Expression |
|---|---|---|---|---|---|---|
| GSE17351 | GPC2 | 221914 | 239422_at | 0.2896 | 0.3872 | |
| GSE26886 | GPC2 | 221914 | 239422_at | 0.5143 | 0.0018 | |
| GSE45670 | GPC2 | 221914 | 239422_at | 0.1223 | 0.3340 | |
| GSE53622 | GPC2 | 221914 | 118730 | 1.1171 | 0.0000 | |
| GSE53624 | GPC2 | 221914 | 118730 | 1.5322 | 0.0000 | |
| GSE63941 | GPC2 | 221914 | 239422_at | 0.1108 | 0.6462 | |
| GSE77861 | GPC2 | 221914 | 239422_at | -0.0865 | 0.5362 | |
| GSE97050 | GPC2 | 221914 | A_23_P251795 | 0.0091 | 0.9739 | |
| SRP064894 | GPC2 | 221914 | RNAseq | 1.2477 | 0.0002 | |
| SRP133303 | GPC2 | 221914 | RNAseq | 1.5865 | 0.0000 | |
| SRP159526 | GPC2 | 221914 | RNAseq | 2.4104 | 0.0019 | |
| SRP219564 | GPC2 | 221914 | RNAseq | 1.0527 | 0.0640 | |
| TCGA | GPC2 | 221914 | RNAseq | 2.1606 | 0.0000 |
Upregulated datasets: 6; Downregulated datasets: 0.
Survival by GPC2 expression:
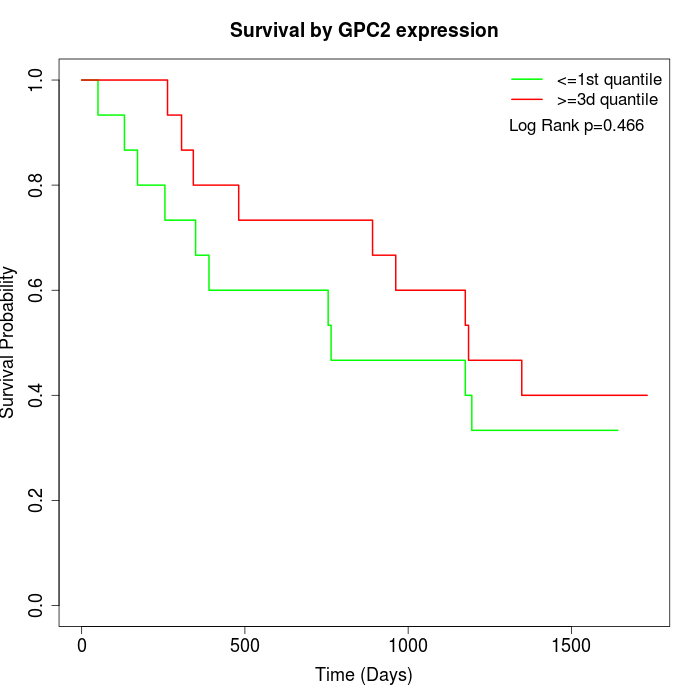 | 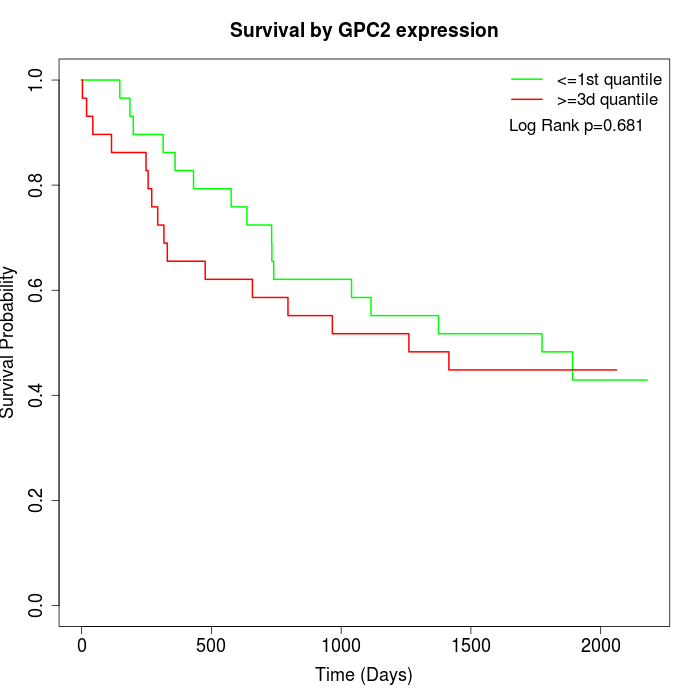 | 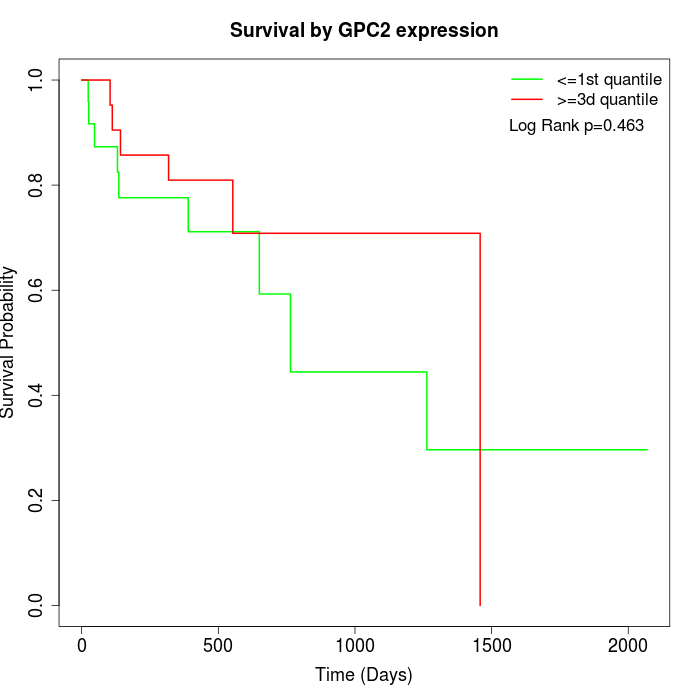 |
| GSE53622 | GSE53624 | TCGA |
Note: Click image to view full size file.
Copy number change of GPC2:
| Dataset | Gene | EntrezID | Gain | Loss | Normal | Detail |
|---|---|---|---|---|---|---|
| GSE15526 | GPC2 | 221914 | 13 | 0 | 17 | |
| GSE20123 | GPC2 | 221914 | 13 | 0 | 17 | |
| GSE43470 | GPC2 | 221914 | 6 | 2 | 35 | |
| GSE46452 | GPC2 | 221914 | 11 | 1 | 47 | |
| GSE47630 | GPC2 | 221914 | 7 | 3 | 30 | |
| GSE54993 | GPC2 | 221914 | 1 | 9 | 60 | |
| GSE54994 | GPC2 | 221914 | 15 | 3 | 35 | |
| GSE60625 | GPC2 | 221914 | 0 | 0 | 11 | |
| GSE74703 | GPC2 | 221914 | 6 | 1 | 29 | |
| GSE74704 | GPC2 | 221914 | 9 | 0 | 11 | |
| TCGA | GPC2 | 221914 | 52 | 6 | 38 |
Total number of gains: 133; Total number of losses: 25; Total Number of normals: 330.
Somatic mutations of GPC2:
Generating mutation plots.
Highly correlated genes for GPC2:
Showing top 20/229 corelated genes with mean PCC>0.5.
| Gene1 | Gene2 | Mean PCC | Num. Datasets | Num. PCC<0 | Num. PCC>0.5 |
|---|---|---|---|---|---|
| GPC2 | LIM2 | 0.819065 | 3 | 0 | 3 |
| GPC2 | GRIN1 | 0.811243 | 3 | 0 | 3 |
| GPC2 | RASL10B | 0.799111 | 3 | 0 | 3 |
| GPC2 | IPO13 | 0.790484 | 3 | 0 | 3 |
| GPC2 | AGAP2 | 0.768784 | 3 | 0 | 3 |
| GPC2 | GAS6-AS1 | 0.767813 | 3 | 0 | 3 |
| GPC2 | C19orf25 | 0.758766 | 3 | 0 | 3 |
| GPC2 | FOXB1 | 0.757865 | 3 | 0 | 3 |
| GPC2 | PICK1 | 0.744114 | 3 | 0 | 3 |
| GPC2 | CHD5 | 0.734264 | 3 | 0 | 3 |
| GPC2 | CABP1 | 0.729919 | 3 | 0 | 3 |
| GPC2 | AANAT | 0.729742 | 3 | 0 | 3 |
| GPC2 | PGC | 0.725429 | 3 | 0 | 3 |
| GPC2 | CBS | 0.724214 | 3 | 0 | 3 |
| GPC2 | CDC34 | 0.723415 | 3 | 0 | 3 |
| GPC2 | EDA | 0.722483 | 3 | 0 | 3 |
| GPC2 | PCIF1 | 0.71947 | 3 | 0 | 3 |
| GPC2 | RIN1 | 0.718013 | 3 | 0 | 3 |
| GPC2 | DUSP15 | 0.716977 | 3 | 0 | 3 |
| GPC2 | FBXL8 | 0.711111 | 4 | 0 | 4 |
For details and further investigation, click here