| Full name: HMG-box transcription factor 1 | Alias Symbol: | ||
| Type: protein-coding gene | Cytoband: 7q22.3 | ||
| Entrez ID: 26959 | HGNC ID: HGNC:23200 | Ensembl Gene: ENSG00000105856 | OMIM ID: 616714 |
Expression of HBP1:
| Dataset | Gene | EntrezID | Probe | Log2FC | Adj.pValue | Expression |
|---|---|---|---|---|---|---|
| GSE17351 | HBP1 | 26959 | 209102_s_at | -0.7856 | 0.0822 | |
| GSE20347 | HBP1 | 26959 | 209102_s_at | -1.0262 | 0.0000 | |
| GSE23400 | HBP1 | 26959 | 209102_s_at | -0.7531 | 0.0000 | |
| GSE26886 | HBP1 | 26959 | 209102_s_at | -1.1316 | 0.0000 | |
| GSE29001 | HBP1 | 26959 | 209102_s_at | -0.8991 | 0.0011 | |
| GSE38129 | HBP1 | 26959 | 209102_s_at | -0.8620 | 0.0000 | |
| GSE45670 | HBP1 | 26959 | 209102_s_at | -0.7484 | 0.0005 | |
| GSE63941 | HBP1 | 26959 | 209102_s_at | -0.8975 | 0.0296 | |
| GSE77861 | HBP1 | 26959 | 209102_s_at | -0.8895 | 0.0099 | |
| GSE97050 | HBP1 | 26959 | A_23_P215787 | -0.2711 | 0.2611 | |
| SRP007169 | HBP1 | 26959 | RNAseq | -2.5310 | 0.0000 | |
| SRP008496 | HBP1 | 26959 | RNAseq | -2.4237 | 0.0000 | |
| SRP064894 | HBP1 | 26959 | RNAseq | -1.2305 | 0.0000 | |
| SRP133303 | HBP1 | 26959 | RNAseq | -0.8611 | 0.0000 | |
| SRP159526 | HBP1 | 26959 | RNAseq | -1.0464 | 0.0005 | |
| SRP193095 | HBP1 | 26959 | RNAseq | -1.1555 | 0.0000 | |
| SRP219564 | HBP1 | 26959 | RNAseq | -1.1643 | 0.0021 | |
| TCGA | HBP1 | 26959 | RNAseq | -0.0739 | 0.1074 |
Upregulated datasets: 0; Downregulated datasets: 8.
Survival by HBP1 expression:
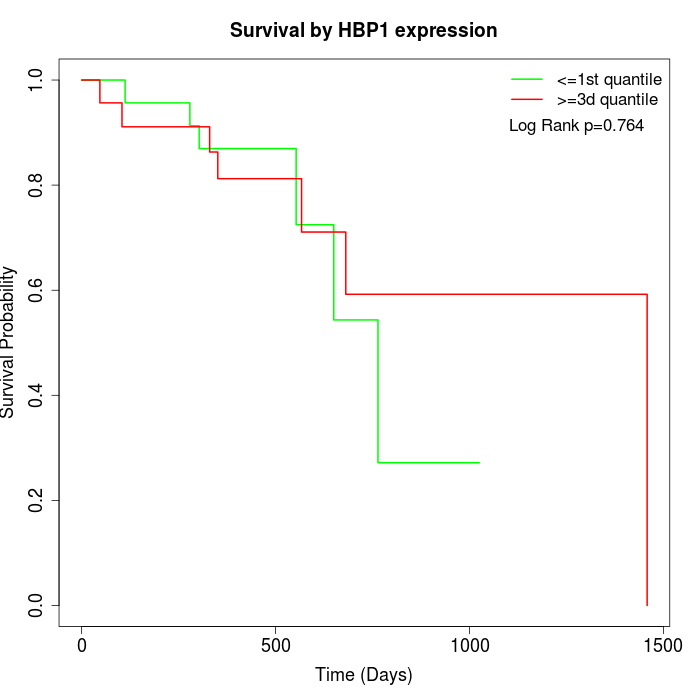 |
| TCGA |
Note: Click image to view full size file.
Copy number change of HBP1:
| Dataset | Gene | EntrezID | Gain | Loss | Normal | Detail |
|---|---|---|---|---|---|---|
| GSE15526 | HBP1 | 26959 | 12 | 0 | 18 | |
| GSE20123 | HBP1 | 26959 | 12 | 0 | 18 | |
| GSE43470 | HBP1 | 26959 | 6 | 2 | 35 | |
| GSE46452 | HBP1 | 26959 | 10 | 1 | 48 | |
| GSE47630 | HBP1 | 26959 | 8 | 3 | 29 | |
| GSE54993 | HBP1 | 26959 | 2 | 9 | 59 | |
| GSE54994 | HBP1 | 26959 | 16 | 3 | 34 | |
| GSE60625 | HBP1 | 26959 | 0 | 0 | 11 | |
| GSE74703 | HBP1 | 26959 | 6 | 2 | 28 | |
| GSE74704 | HBP1 | 26959 | 8 | 0 | 12 | |
| TCGA | HBP1 | 26959 | 50 | 10 | 36 |
Total number of gains: 130; Total number of losses: 30; Total Number of normals: 328.
Somatic mutations of HBP1:
Generating mutation plots.
Highly correlated genes for HBP1:
Showing top 20/1687 corelated genes with mean PCC>0.5.
| Gene1 | Gene2 | Mean PCC | Num. Datasets | Num. PCC<0 | Num. PCC>0.5 |
|---|---|---|---|---|---|
| HBP1 | ZHX1 | 0.830097 | 4 | 0 | 4 |
| HBP1 | HPGD | 0.817302 | 9 | 0 | 9 |
| HBP1 | ANKRD13A | 0.815838 | 5 | 0 | 5 |
| HBP1 | FBXO8 | 0.815054 | 5 | 0 | 5 |
| HBP1 | FAM214A | 0.811371 | 5 | 0 | 5 |
| HBP1 | CCNDBP1 | 0.811262 | 5 | 0 | 5 |
| HBP1 | GBP6 | 0.810831 | 4 | 0 | 4 |
| HBP1 | LNX1 | 0.810249 | 5 | 0 | 5 |
| HBP1 | WDR26 | 0.80375 | 8 | 0 | 8 |
| HBP1 | SH3BGRL2 | 0.79699 | 5 | 0 | 5 |
| HBP1 | CGNL1 | 0.794724 | 5 | 0 | 5 |
| HBP1 | ACPP | 0.789459 | 8 | 0 | 8 |
| HBP1 | C18orf25 | 0.788274 | 9 | 0 | 9 |
| HBP1 | ARRDC3 | 0.785496 | 5 | 0 | 5 |
| HBP1 | C5orf66-AS1 | 0.785464 | 4 | 0 | 4 |
| HBP1 | AIF1L | 0.784153 | 3 | 0 | 3 |
| HBP1 | SORT1 | 0.783794 | 9 | 0 | 9 |
| HBP1 | SASH1 | 0.782625 | 10 | 0 | 10 |
| HBP1 | KAT2B | 0.782438 | 10 | 0 | 10 |
| HBP1 | DOCK9 | 0.77861 | 9 | 0 | 9 |
For details and further investigation, click here