| Full name: sortilin 1 | Alias Symbol: Gp95|NT3 | ||
| Type: protein-coding gene | Cytoband: 1p13.3 | ||
| Entrez ID: 6272 | HGNC ID: HGNC:11186 | Ensembl Gene: ENSG00000134243 | OMIM ID: 602458 |
SORT1 involved pathways:
| KEGG pathway | Description | View |
|---|---|---|
| hsa04722 | Neurotrophin signaling pathway |
Expression of SORT1:
| Dataset | Gene | EntrezID | Probe | Log2FC | Adj.pValue | Expression |
|---|---|---|---|---|---|---|
| GSE17351 | SORT1 | 6272 | 224818_at | -1.5083 | 0.0540 | |
| GSE20347 | SORT1 | 6272 | 212807_s_at | -2.1208 | 0.0000 | |
| GSE23400 | SORT1 | 6272 | 212807_s_at | -1.3691 | 0.0000 | |
| GSE26886 | SORT1 | 6272 | 224818_at | -2.2554 | 0.0000 | |
| GSE29001 | SORT1 | 6272 | 212807_s_at | -2.1003 | 0.0001 | |
| GSE38129 | SORT1 | 6272 | 212807_s_at | -1.6095 | 0.0000 | |
| GSE45670 | SORT1 | 6272 | 224818_at | -0.9229 | 0.0031 | |
| GSE53622 | SORT1 | 6272 | 54469 | -1.8666 | 0.0000 | |
| GSE53624 | SORT1 | 6272 | 54469 | -1.9573 | 0.0000 | |
| GSE63941 | SORT1 | 6272 | 224818_at | -0.6208 | 0.4633 | |
| GSE77861 | SORT1 | 6272 | 224818_at | -1.4758 | 0.0004 | |
| GSE97050 | SORT1 | 6272 | A_24_P325520 | -1.1762 | 0.0555 | |
| SRP007169 | SORT1 | 6272 | RNAseq | -2.9470 | 0.0000 | |
| SRP008496 | SORT1 | 6272 | RNAseq | -2.9871 | 0.0000 | |
| SRP064894 | SORT1 | 6272 | RNAseq | -1.8481 | 0.0000 | |
| SRP133303 | SORT1 | 6272 | RNAseq | -1.6917 | 0.0000 | |
| SRP159526 | SORT1 | 6272 | RNAseq | -1.8452 | 0.0000 | |
| SRP193095 | SORT1 | 6272 | RNAseq | -2.1809 | 0.0000 | |
| SRP219564 | SORT1 | 6272 | RNAseq | -1.6800 | 0.0019 | |
| TCGA | SORT1 | 6272 | RNAseq | -0.3600 | 0.0001 |
Upregulated datasets: 0; Downregulated datasets: 15.
Survival by SORT1 expression:
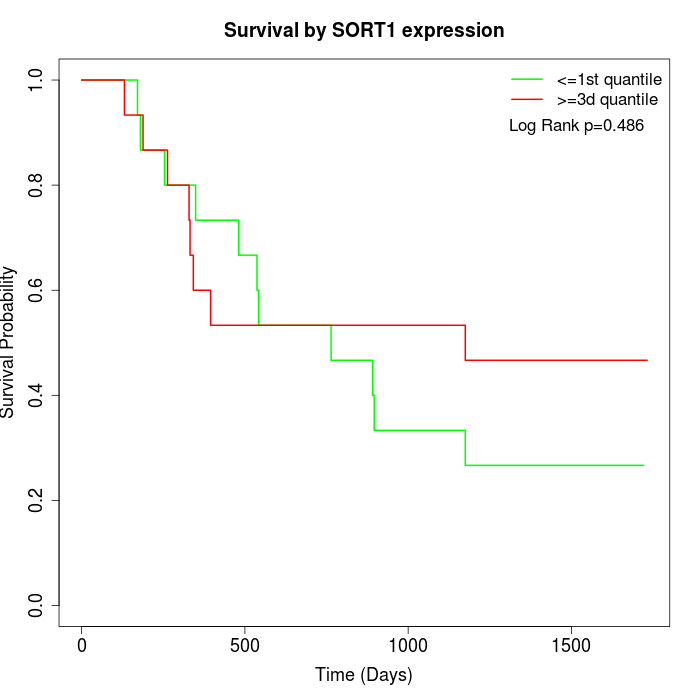 | 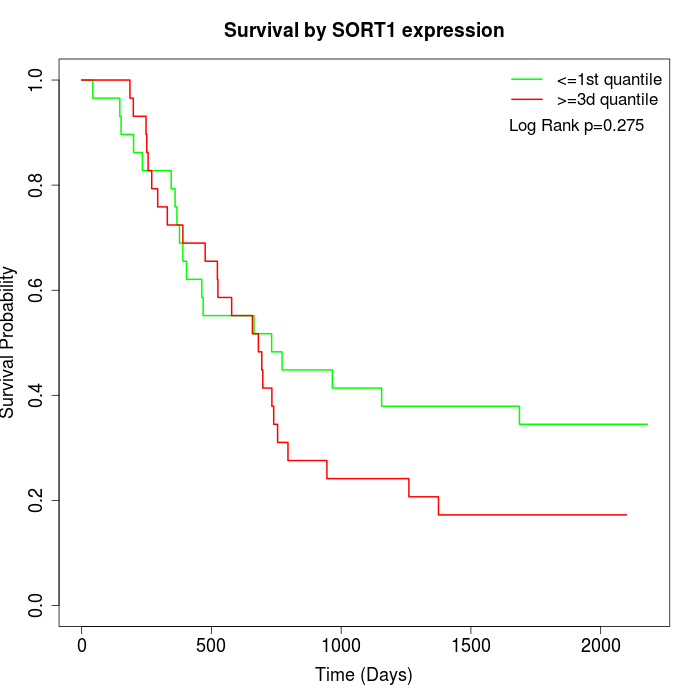 | 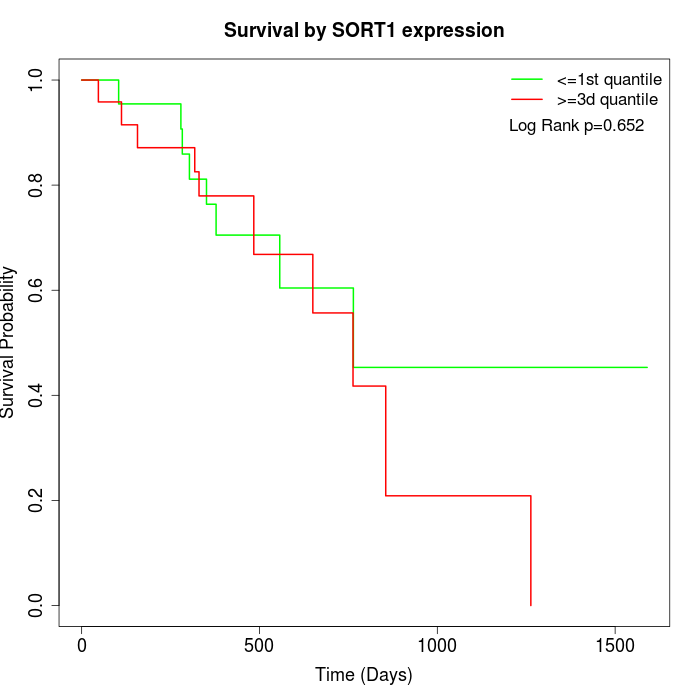 |
| GSE53622 | GSE53624 | TCGA |
Note: Click image to view full size file.
Copy number change of SORT1:
| Dataset | Gene | EntrezID | Gain | Loss | Normal | Detail |
|---|---|---|---|---|---|---|
| GSE15526 | SORT1 | 6272 | 0 | 12 | 18 | |
| GSE20123 | SORT1 | 6272 | 0 | 11 | 19 | |
| GSE43470 | SORT1 | 6272 | 0 | 8 | 35 | |
| GSE46452 | SORT1 | 6272 | 2 | 1 | 56 | |
| GSE47630 | SORT1 | 6272 | 9 | 5 | 26 | |
| GSE54993 | SORT1 | 6272 | 0 | 1 | 69 | |
| GSE54994 | SORT1 | 6272 | 7 | 4 | 42 | |
| GSE60625 | SORT1 | 6272 | 0 | 0 | 11 | |
| GSE74703 | SORT1 | 6272 | 0 | 6 | 30 | |
| GSE74704 | SORT1 | 6272 | 0 | 7 | 13 | |
| TCGA | SORT1 | 6272 | 9 | 26 | 61 |
Total number of gains: 27; Total number of losses: 81; Total Number of normals: 380.
Somatic mutations of SORT1:
Generating mutation plots.
Highly correlated genes for SORT1:
Showing top 20/2138 corelated genes with mean PCC>0.5.
| Gene1 | Gene2 | Mean PCC | Num. Datasets | Num. PCC<0 | Num. PCC>0.5 |
|---|---|---|---|---|---|
| SORT1 | SNORA68 | 0.863488 | 4 | 0 | 4 |
| SORT1 | ACOX3 | 0.860374 | 10 | 0 | 10 |
| SORT1 | CTTNBP2 | 0.859205 | 6 | 0 | 6 |
| SORT1 | CGNL1 | 0.857503 | 7 | 0 | 7 |
| SORT1 | SCNN1B | 0.847605 | 10 | 0 | 10 |
| SORT1 | USP54 | 0.844491 | 7 | 0 | 7 |
| SORT1 | UBL3 | 0.843407 | 10 | 0 | 10 |
| SORT1 | ACOX1 | 0.841236 | 11 | 0 | 11 |
| SORT1 | MTMR10 | 0.840689 | 7 | 0 | 7 |
| SORT1 | ACAA1 | 0.83983 | 8 | 0 | 8 |
| SORT1 | MPP7 | 0.839072 | 7 | 0 | 7 |
| SORT1 | CPEB3 | 0.833122 | 10 | 0 | 10 |
| SORT1 | GYS2 | 0.832564 | 10 | 0 | 10 |
| SORT1 | SASH1 | 0.83222 | 11 | 0 | 11 |
| SORT1 | GDPD3 | 0.825823 | 10 | 0 | 10 |
| SORT1 | EIF4E3 | 0.825724 | 7 | 0 | 7 |
| SORT1 | C5orf66-AS1 | 0.824648 | 6 | 0 | 6 |
| SORT1 | ARHGEF10L | 0.823594 | 11 | 0 | 11 |
| SORT1 | RAB11A | 0.823449 | 11 | 0 | 11 |
| SORT1 | SHROOM3 | 0.823431 | 7 | 0 | 7 |
For details and further investigation, click here