| Full name: HBS1 like translational GTPase | Alias Symbol: ERFS|HBS1|HSPC276|KIAA1038|DKFZp434g247|EF-1a|eRF3c | ||
| Type: protein-coding gene | Cytoband: 6q23.3 | ||
| Entrez ID: 10767 | HGNC ID: HGNC:4834 | Ensembl Gene: ENSG00000112339 | OMIM ID: 612450 |
Screen Evidence:
| |||
Expression of HBS1L:
| Dataset | Gene | EntrezID | Probe | Log2FC | Adj.pValue | Expression |
|---|---|---|---|---|---|---|
| GSE17351 | HBS1L | 10767 | 209316_s_at | 0.1800 | 0.7140 | |
| GSE20347 | HBS1L | 10767 | 209316_s_at | 0.1263 | 0.6549 | |
| GSE23400 | HBS1L | 10767 | 209316_s_at | 0.1413 | 0.0724 | |
| GSE26886 | HBS1L | 10767 | 209316_s_at | -1.0360 | 0.0000 | |
| GSE29001 | HBS1L | 10767 | 209316_s_at | 0.2156 | 0.4023 | |
| GSE38129 | HBS1L | 10767 | 209316_s_at | 0.2092 | 0.2377 | |
| GSE45670 | HBS1L | 10767 | 209316_s_at | -0.2229 | 0.0262 | |
| GSE53622 | HBS1L | 10767 | 31546 | -0.3156 | 0.0001 | |
| GSE53624 | HBS1L | 10767 | 31546 | 0.0107 | 0.8694 | |
| GSE63941 | HBS1L | 10767 | 209316_s_at | -0.4384 | 0.4190 | |
| GSE77861 | HBS1L | 10767 | 209316_s_at | -0.0793 | 0.8613 | |
| GSE97050 | HBS1L | 10767 | A_33_P3289192 | -0.3922 | 0.1616 | |
| SRP007169 | HBS1L | 10767 | RNAseq | -0.0684 | 0.8430 | |
| SRP008496 | HBS1L | 10767 | RNAseq | 0.0724 | 0.6675 | |
| SRP064894 | HBS1L | 10767 | RNAseq | -0.0278 | 0.8839 | |
| SRP133303 | HBS1L | 10767 | RNAseq | 0.1133 | 0.2471 | |
| SRP159526 | HBS1L | 10767 | RNAseq | 0.0610 | 0.6879 | |
| SRP193095 | HBS1L | 10767 | RNAseq | -0.3003 | 0.0001 | |
| SRP219564 | HBS1L | 10767 | RNAseq | -0.4687 | 0.1214 | |
| TCGA | HBS1L | 10767 | RNAseq | -0.0321 | 0.5112 |
Upregulated datasets: 0; Downregulated datasets: 1.
Survival by HBS1L expression:
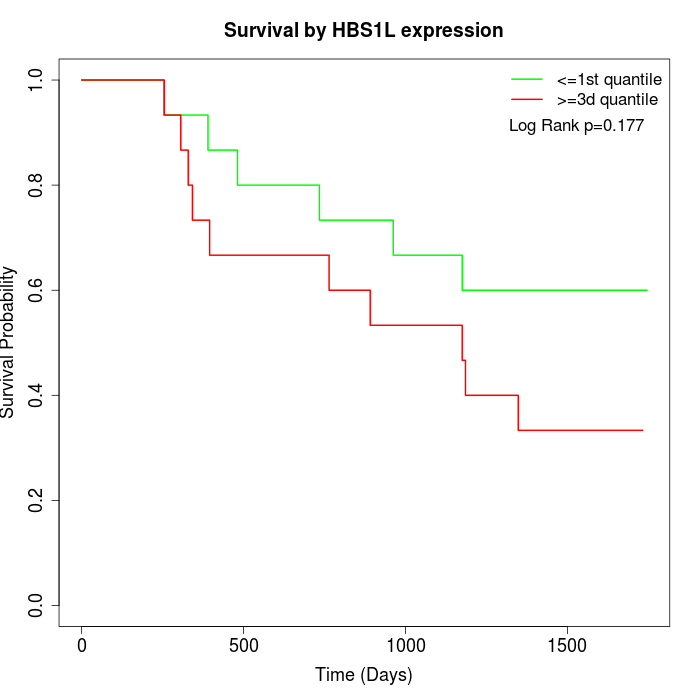 | 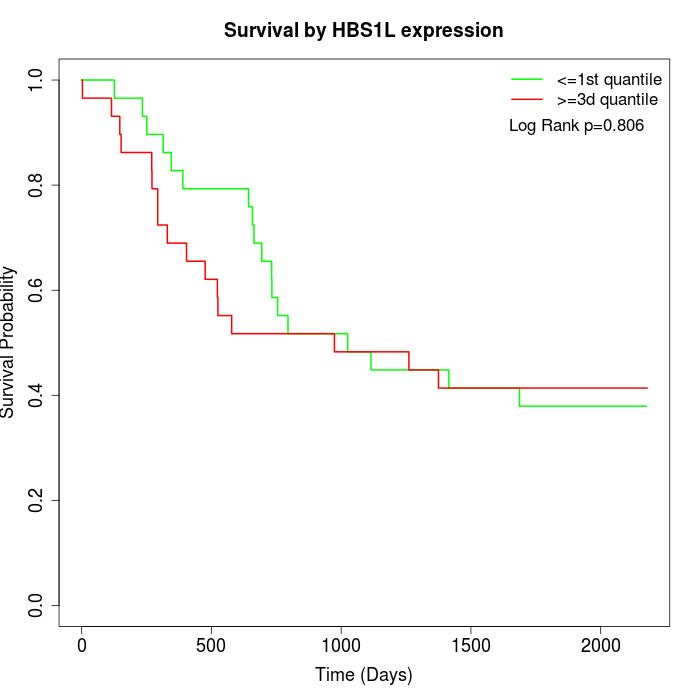 | 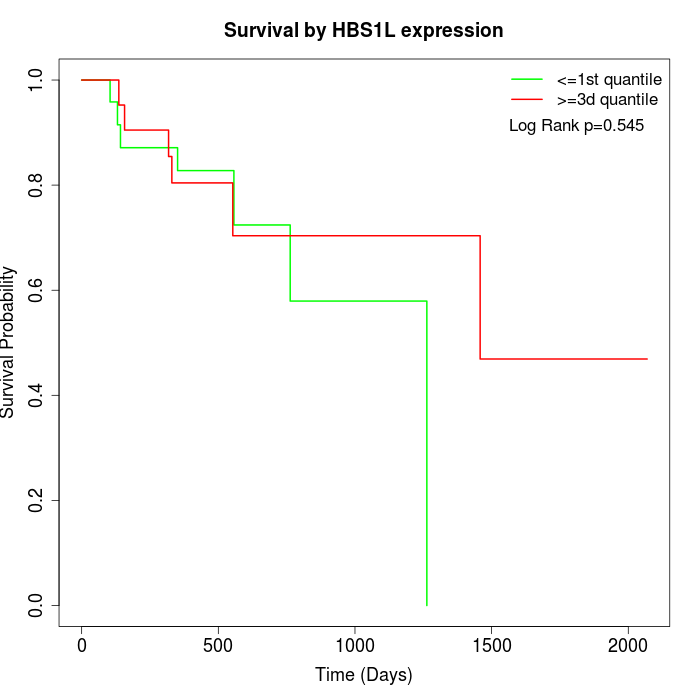 |
| GSE53622 | GSE53624 | TCGA |
Note: Click image to view full size file.
Copy number change of HBS1L:
| Dataset | Gene | EntrezID | Gain | Loss | Normal | Detail |
|---|---|---|---|---|---|---|
| GSE15526 | HBS1L | 10767 | 5 | 4 | 21 | |
| GSE20123 | HBS1L | 10767 | 5 | 3 | 22 | |
| GSE43470 | HBS1L | 10767 | 5 | 0 | 38 | |
| GSE46452 | HBS1L | 10767 | 3 | 10 | 46 | |
| GSE47630 | HBS1L | 10767 | 10 | 4 | 26 | |
| GSE54993 | HBS1L | 10767 | 3 | 2 | 65 | |
| GSE54994 | HBS1L | 10767 | 9 | 7 | 37 | |
| GSE60625 | HBS1L | 10767 | 0 | 1 | 10 | |
| GSE74703 | HBS1L | 10767 | 4 | 0 | 32 | |
| GSE74704 | HBS1L | 10767 | 2 | 1 | 17 | |
| TCGA | HBS1L | 10767 | 13 | 17 | 66 |
Total number of gains: 59; Total number of losses: 49; Total Number of normals: 380.
Somatic mutations of HBS1L:
Generating mutation plots.
Highly correlated genes for HBS1L:
Showing top 20/141 corelated genes with mean PCC>0.5.
| Gene1 | Gene2 | Mean PCC | Num. Datasets | Num. PCC<0 | Num. PCC>0.5 |
|---|---|---|---|---|---|
| HBS1L | HCCS | 0.78076 | 3 | 0 | 3 |
| HBS1L | ZNF607 | 0.726237 | 3 | 0 | 3 |
| HBS1L | MCU | 0.714461 | 3 | 0 | 3 |
| HBS1L | PPM1B | 0.707774 | 5 | 0 | 5 |
| HBS1L | UBE2J1 | 0.705274 | 4 | 0 | 3 |
| HBS1L | FEM1A | 0.70337 | 3 | 0 | 3 |
| HBS1L | KBTBD8 | 0.701039 | 3 | 0 | 3 |
| HBS1L | GOLGA4 | 0.698621 | 4 | 0 | 3 |
| HBS1L | TSPAN5 | 0.695425 | 3 | 0 | 3 |
| HBS1L | GAPT | 0.692509 | 3 | 0 | 3 |
| HBS1L | DCAF10 | 0.689246 | 3 | 0 | 3 |
| HBS1L | TTC33 | 0.682743 | 3 | 0 | 3 |
| HBS1L | HDAC5 | 0.67401 | 4 | 0 | 4 |
| HBS1L | IST1 | 0.670647 | 3 | 0 | 3 |
| HBS1L | ADHFE1 | 0.666007 | 3 | 0 | 3 |
| HBS1L | FGFR1OP2 | 0.661795 | 3 | 0 | 3 |
| HBS1L | CMTM4 | 0.661751 | 3 | 0 | 3 |
| HBS1L | ACO2 | 0.660666 | 3 | 0 | 3 |
| HBS1L | SNX20 | 0.657874 | 3 | 0 | 3 |
| HBS1L | UBE4B | 0.65682 | 4 | 0 | 4 |
For details and further investigation, click here