| Full name: mitochondrial calcium uniporter | Alias Symbol: FLJ46135 | ||
| Type: protein-coding gene | Cytoband: 10q22.1 | ||
| Entrez ID: 90550 | HGNC ID: HGNC:23526 | Ensembl Gene: ENSG00000156026 | OMIM ID: 614197 |
Expression of MCU:
| Dataset | Gene | EntrezID | Probe | Log2FC | Adj.pValue | Expression |
|---|---|---|---|---|---|---|
| GSE17351 | MCU | 90550 | 225320_at | 0.4368 | 0.2609 | |
| GSE26886 | MCU | 90550 | 225320_at | -1.2337 | 0.0000 | |
| GSE45670 | MCU | 90550 | 225320_at | 0.0740 | 0.6806 | |
| GSE53622 | MCU | 90550 | 70422 | -0.3500 | 0.0001 | |
| GSE53624 | MCU | 90550 | 70422 | -0.5652 | 0.0000 | |
| GSE63941 | MCU | 90550 | 225320_at | 0.2233 | 0.5792 | |
| GSE77861 | MCU | 90550 | 225320_at | -0.2316 | 0.4198 | |
| GSE97050 | MCU | 90550 | A_23_P346405 | -0.1836 | 0.4444 | |
| SRP007169 | MCU | 90550 | RNAseq | -1.2482 | 0.0157 | |
| SRP008496 | MCU | 90550 | RNAseq | -1.1139 | 0.0002 | |
| SRP064894 | MCU | 90550 | RNAseq | -0.9532 | 0.0000 | |
| SRP133303 | MCU | 90550 | RNAseq | 0.1443 | 0.4544 | |
| SRP159526 | MCU | 90550 | RNAseq | -0.7472 | 0.0630 | |
| SRP193095 | MCU | 90550 | RNAseq | -1.2400 | 0.0000 | |
| SRP219564 | MCU | 90550 | RNAseq | -0.7799 | 0.0637 |
Upregulated datasets: 0; Downregulated datasets: 4.
Survival by MCU expression:
 | 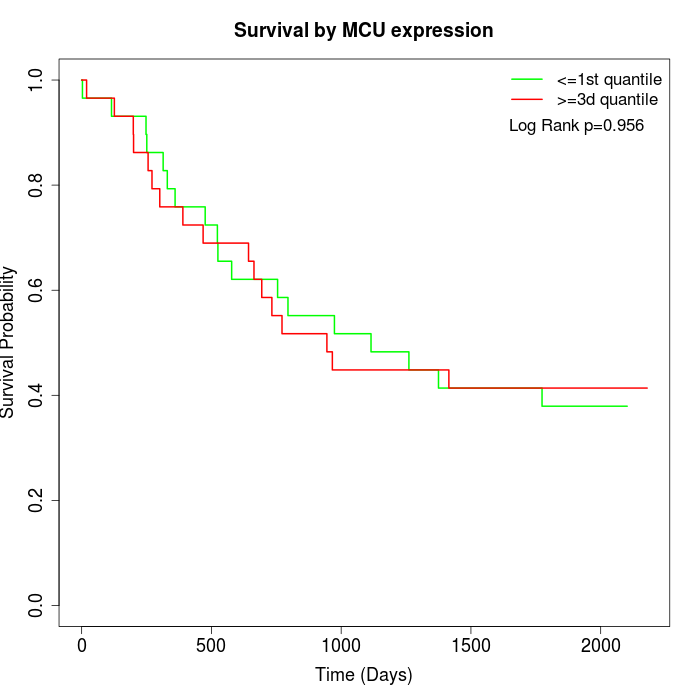 |
| GSE53622 | GSE53624 |
Note: Click image to view full size file.
Copy number change of MCU:
| Dataset | Gene | EntrezID | Gain | Loss | Normal | Detail |
|---|---|---|---|---|---|---|
| GSE15526 | MCU | 90550 | 4 | 4 | 22 | |
| GSE20123 | MCU | 90550 | 4 | 3 | 23 | |
| GSE43470 | MCU | 90550 | 1 | 8 | 34 | |
| GSE46452 | MCU | 90550 | 0 | 11 | 48 | |
| GSE47630 | MCU | 90550 | 2 | 14 | 24 | |
| GSE54993 | MCU | 90550 | 7 | 0 | 63 | |
| GSE54994 | MCU | 90550 | 2 | 11 | 40 | |
| GSE60625 | MCU | 90550 | 0 | 0 | 11 | |
| GSE74703 | MCU | 90550 | 1 | 5 | 30 | |
| GSE74704 | MCU | 90550 | 2 | 1 | 17 | |
| TCGA | MCU | 90550 | 11 | 24 | 61 |
Total number of gains: 34; Total number of losses: 81; Total Number of normals: 373.
Somatic mutations of MCU:
Generating mutation plots.
Highly correlated genes for MCU:
Showing top 20/296 corelated genes with mean PCC>0.5.
| Gene1 | Gene2 | Mean PCC | Num. Datasets | Num. PCC<0 | Num. PCC>0.5 |
|---|---|---|---|---|---|
| MCU | POLE3 | 0.777932 | 3 | 0 | 3 |
| MCU | SCAMP2 | 0.774028 | 3 | 0 | 3 |
| MCU | PLEKHM1 | 0.769158 | 3 | 0 | 3 |
| MCU | MRPS7 | 0.76387 | 3 | 0 | 3 |
| MCU | KDM1A | 0.755965 | 3 | 0 | 3 |
| MCU | PAPSS1 | 0.751774 | 3 | 0 | 3 |
| MCU | ARPC1A | 0.751635 | 3 | 0 | 3 |
| MCU | CCDC117 | 0.748157 | 3 | 0 | 3 |
| MCU | ANKRD13C | 0.736525 | 3 | 0 | 3 |
| MCU | AASDHPPT | 0.731672 | 3 | 0 | 3 |
| MCU | CSDE1 | 0.728828 | 3 | 0 | 3 |
| MCU | SFPQ | 0.726028 | 3 | 0 | 3 |
| MCU | MFSD5 | 0.725493 | 4 | 0 | 4 |
| MCU | EIF4A3 | 0.720643 | 3 | 0 | 3 |
| MCU | PRPSAP1 | 0.719305 | 3 | 0 | 3 |
| MCU | EXOC6B | 0.717855 | 3 | 0 | 3 |
| MCU | VPS4B | 0.716845 | 4 | 0 | 4 |
| MCU | RAB3D | 0.716774 | 3 | 0 | 3 |
| MCU | HBS1L | 0.714461 | 3 | 0 | 3 |
| MCU | NT5DC2 | 0.710066 | 3 | 0 | 3 |
For details and further investigation, click here