| Full name: integrin binding sialoprotein | Alias Symbol: BSP|SP-II|BSP-II | ||
| Type: protein-coding gene | Cytoband: 4q22.1 | ||
| Entrez ID: 3381 | HGNC ID: HGNC:5341 | Ensembl Gene: ENSG00000029559 | OMIM ID: 147563 |
| Related drugs: CYCLOSPORINE, DAIDZEIN, STAUROSPORINE, ZOLEDRONIC ACID... [more] | |||
IBSP involved pathways:
| KEGG pathway | Description | View |
|---|---|---|
| hsa04151 | PI3K-Akt signaling pathway | |
| hsa04510 | Focal adhesion |
Expression of IBSP:
| Dataset | Gene | EntrezID | Probe | Log2FC | Adj.pValue | Expression |
|---|---|---|---|---|---|---|
| GSE17351 | IBSP | 3381 | 207370_at | 0.0571 | 0.8683 | |
| GSE20347 | IBSP | 3381 | 207370_at | 0.0008 | 0.9939 | |
| GSE23400 | IBSP | 3381 | 207370_at | -0.1703 | 0.0000 | |
| GSE26886 | IBSP | 3381 | 207370_at | 0.1432 | 0.3738 | |
| GSE29001 | IBSP | 3381 | 207370_at | -0.1989 | 0.1518 | |
| GSE38129 | IBSP | 3381 | 207370_at | -0.0532 | 0.4941 | |
| GSE45670 | IBSP | 3381 | 207370_at | 0.0835 | 0.5231 | |
| GSE63941 | IBSP | 3381 | 207370_at | 0.2699 | 0.0677 | |
| GSE77861 | IBSP | 3381 | 207370_at | -0.0903 | 0.4456 | |
| GSE97050 | IBSP | 3381 | A_23_P144549 | 1.1337 | 0.1223 | |
| SRP159526 | IBSP | 3381 | RNAseq | 7.0679 | 0.0000 | |
| TCGA | IBSP | 3381 | RNAseq | 6.2657 | 0.0000 |
Upregulated datasets: 2; Downregulated datasets: 0.
Survival by IBSP expression:
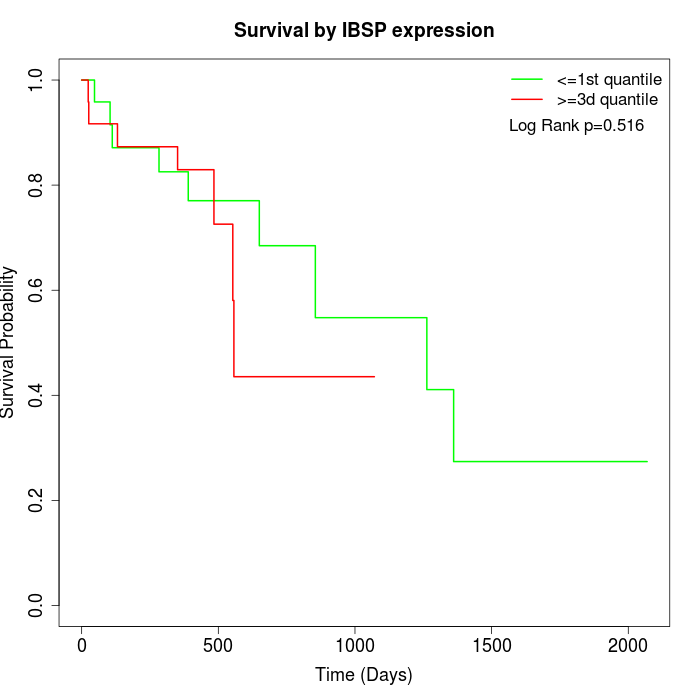 |
| TCGA |
Note: Click image to view full size file.
Copy number change of IBSP:
| Dataset | Gene | EntrezID | Gain | Loss | Normal | Detail |
|---|---|---|---|---|---|---|
| GSE15526 | IBSP | 3381 | 3 | 12 | 15 | |
| GSE20123 | IBSP | 3381 | 3 | 12 | 15 | |
| GSE43470 | IBSP | 3381 | 0 | 13 | 30 | |
| GSE46452 | IBSP | 3381 | 1 | 36 | 22 | |
| GSE47630 | IBSP | 3381 | 0 | 20 | 20 | |
| GSE54993 | IBSP | 3381 | 8 | 0 | 62 | |
| GSE54994 | IBSP | 3381 | 1 | 9 | 43 | |
| GSE60625 | IBSP | 3381 | 0 | 0 | 11 | |
| GSE74703 | IBSP | 3381 | 0 | 11 | 25 | |
| GSE74704 | IBSP | 3381 | 2 | 7 | 11 | |
| TCGA | IBSP | 3381 | 12 | 36 | 48 |
Total number of gains: 30; Total number of losses: 156; Total Number of normals: 302.
Somatic mutations of IBSP:
Generating mutation plots.
Highly correlated genes for IBSP:
Showing top 20/394 corelated genes with mean PCC>0.5.
| Gene1 | Gene2 | Mean PCC | Num. Datasets | Num. PCC<0 | Num. PCC>0.5 |
|---|---|---|---|---|---|
| IBSP | APOC2 | 0.694055 | 3 | 0 | 3 |
| IBSP | FOXD2-AS1 | 0.694041 | 3 | 0 | 3 |
| IBSP | ZIC5 | 0.674824 | 3 | 0 | 3 |
| IBSP | EXOC3L2 | 0.673099 | 3 | 0 | 3 |
| IBSP | SLC6A6 | 0.655179 | 3 | 0 | 3 |
| IBSP | HOXD8 | 0.648664 | 3 | 0 | 3 |
| IBSP | CCDC134 | 0.647973 | 3 | 0 | 3 |
| IBSP | PTPN7 | 0.638688 | 3 | 0 | 3 |
| IBSP | UNK | 0.627315 | 3 | 0 | 3 |
| IBSP | IGH | 0.624036 | 6 | 0 | 6 |
| IBSP | IL17C | 0.622241 | 4 | 0 | 3 |
| IBSP | WDR31 | 0.621433 | 3 | 0 | 3 |
| IBSP | RHPN1 | 0.619164 | 4 | 0 | 3 |
| IBSP | IL34 | 0.618068 | 4 | 0 | 4 |
| IBSP | IMPG2 | 0.616207 | 5 | 0 | 5 |
| IBSP | GNGT2 | 0.615989 | 3 | 0 | 3 |
| IBSP | KIF24 | 0.61502 | 4 | 0 | 4 |
| IBSP | ATXN2L | 0.614564 | 6 | 0 | 4 |
| IBSP | EFCAB13 | 0.614489 | 3 | 0 | 3 |
| IBSP | MXD3 | 0.612866 | 4 | 0 | 4 |
For details and further investigation, click here