| Full name: EF-hand calcium binding domain 13 | Alias Symbol: FLJ40342 | ||
| Type: protein-coding gene | Cytoband: 17q21.32 | ||
| Entrez ID: 124989 | HGNC ID: HGNC:26864 | Ensembl Gene: ENSG00000178852 | OMIM ID: |
Expression of EFCAB13:
| Dataset | Gene | EntrezID | Probe | Log2FC | Adj.pValue | Expression |
|---|---|---|---|---|---|---|
| GSE17351 | EFCAB13 | 124989 | 231651_at | -0.0058 | 0.9868 | |
| GSE26886 | EFCAB13 | 124989 | 231651_at | 0.2932 | 0.0423 | |
| GSE45670 | EFCAB13 | 124989 | 231651_at | 0.0296 | 0.7765 | |
| GSE53622 | EFCAB13 | 124989 | 84093 | -0.8425 | 0.0000 | |
| GSE53624 | EFCAB13 | 124989 | 84093 | -0.8592 | 0.0000 | |
| GSE63941 | EFCAB13 | 124989 | 231651_at | 0.0464 | 0.8204 | |
| GSE77861 | EFCAB13 | 124989 | 231651_at | -0.2258 | 0.1133 | |
| SRP007169 | EFCAB13 | 124989 | RNAseq | -0.5947 | 0.3792 | |
| SRP133303 | EFCAB13 | 124989 | RNAseq | -0.1843 | 0.4417 | |
| SRP159526 | EFCAB13 | 124989 | RNAseq | 0.2189 | 0.6255 | |
| SRP193095 | EFCAB13 | 124989 | RNAseq | -0.4818 | 0.0169 | |
| SRP219564 | EFCAB13 | 124989 | RNAseq | -0.0058 | 0.9907 |
Upregulated datasets: 0; Downregulated datasets: 0.
Survival by EFCAB13 expression:
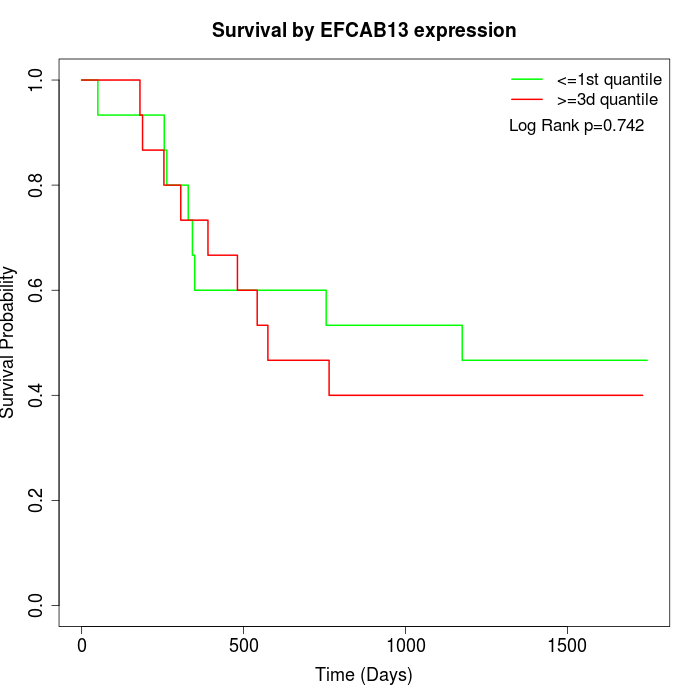 | 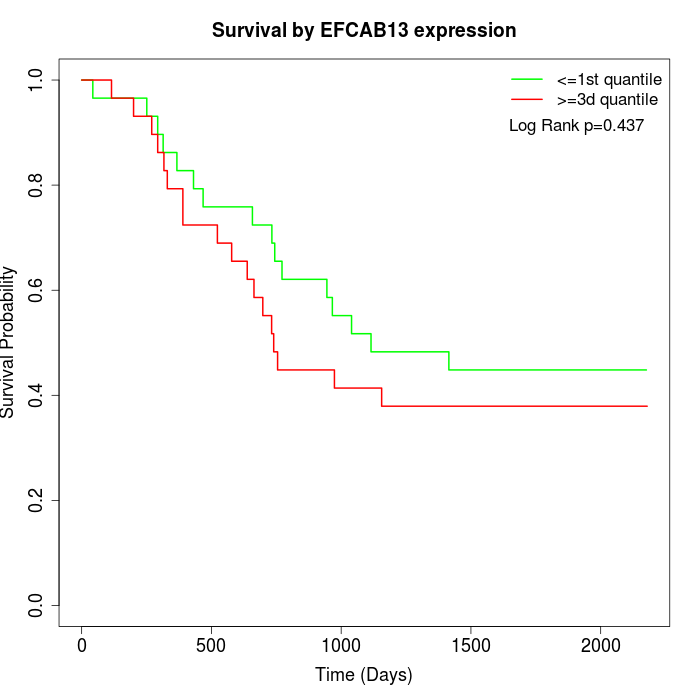 |
| GSE53622 | GSE53624 |
Note: Click image to view full size file.
Copy number change of EFCAB13:
| Dataset | Gene | EntrezID | Gain | Loss | Normal | Detail |
|---|---|---|---|---|---|---|
| GSE15526 | EFCAB13 | 124989 | 5 | 2 | 23 | |
| GSE20123 | EFCAB13 | 124989 | 5 | 2 | 23 | |
| GSE43470 | EFCAB13 | 124989 | 1 | 2 | 40 | |
| GSE46452 | EFCAB13 | 124989 | 32 | 0 | 27 | |
| GSE47630 | EFCAB13 | 124989 | 9 | 0 | 31 | |
| GSE54993 | EFCAB13 | 124989 | 2 | 4 | 64 | |
| GSE54994 | EFCAB13 | 124989 | 11 | 5 | 37 | |
| GSE60625 | EFCAB13 | 124989 | 4 | 0 | 7 | |
| GSE74703 | EFCAB13 | 124989 | 1 | 1 | 34 | |
| GSE74704 | EFCAB13 | 124989 | 4 | 1 | 15 | |
| TCGA | EFCAB13 | 124989 | 27 | 6 | 63 |
Total number of gains: 101; Total number of losses: 23; Total Number of normals: 364.
Somatic mutations of EFCAB13:
Generating mutation plots.
Highly correlated genes for EFCAB13:
Showing top 20/120 corelated genes with mean PCC>0.5.
| Gene1 | Gene2 | Mean PCC | Num. Datasets | Num. PCC<0 | Num. PCC>0.5 |
|---|---|---|---|---|---|
| EFCAB13 | HMCN2 | 0.777394 | 3 | 0 | 3 |
| EFCAB13 | PHOSPHO1 | 0.735481 | 3 | 0 | 3 |
| EFCAB13 | HNF1A | 0.720554 | 3 | 0 | 3 |
| EFCAB13 | FAM99B | 0.716295 | 3 | 0 | 3 |
| EFCAB13 | TUT1 | 0.702941 | 3 | 0 | 3 |
| EFCAB13 | LINC00482 | 0.699309 | 3 | 0 | 3 |
| EFCAB13 | OR1F1 | 0.69395 | 3 | 0 | 3 |
| EFCAB13 | NACAD | 0.692606 | 3 | 0 | 3 |
| EFCAB13 | GNG8 | 0.684244 | 3 | 0 | 3 |
| EFCAB13 | LINC01169 | 0.684006 | 3 | 0 | 3 |
| EFCAB13 | SPPL2C | 0.683021 | 3 | 0 | 3 |
| EFCAB13 | C9orf50 | 0.671605 | 4 | 0 | 4 |
| EFCAB13 | CCL27 | 0.669552 | 4 | 0 | 3 |
| EFCAB13 | HKDC1 | 0.655972 | 3 | 0 | 3 |
| EFCAB13 | GPR17 | 0.650121 | 3 | 0 | 3 |
| EFCAB13 | KAAG1 | 0.644127 | 3 | 0 | 3 |
| EFCAB13 | IL17B | 0.64331 | 3 | 0 | 3 |
| EFCAB13 | ISYNA1 | 0.641846 | 4 | 0 | 3 |
| EFCAB13 | NTN3 | 0.639475 | 4 | 0 | 3 |
| EFCAB13 | RBBP8NL | 0.635577 | 3 | 0 | 3 |
For details and further investigation, click here